
OpenGov: The Startup Analyzing $50B in Spending
“A billion here, a billion there, and pretty soon you’re talking real money!” — attributed to Fmr. Sen. Everett Dirksen
When an entrepreneur arrives with an active list of customers that have more than $50 billion in annual revenue, one tends to pay attention. Zachary Bookman had just such a customer list because he had successfully begun transforming the largest industry in the world: government.
Several years ago, while living in a shipping container in Afghanistan, Zach and his partners (including Joe Lonsdale, co-founder of Palantir) created OpenGov, a startup intended to transform the way governments visualize, analyze, collaborate on, budget, and allocate our tax dollars. Now that OpenGov has signed up more than 150 governments (including cities, counties, state agencies, and school districts) representing more than 22 million residents, we thought it would be useful to discuss why we at Andreessen Horowitz funded them, why they’ve been growing so rapidly, and why we believe their $50 billion customer list is just the start.
The problem
Within the U.S. alone, there are more than 90,000 different local, state, and federal organizations that spend in excess of seven trillion dollars annually ($3.7T federal, $3.4T state). Governments spend money on goods and services that affect our daily lives, including roads, water, firefighters, police, teachers, research, social services, the military, and more besides.
People routinely debate whether government spending should be increased or decreased, but virtually everyone agrees that it should be spent as transparently and efficiently as possible. After all, taxes form the the single largest line item for many citizens, and the single largest source of income for many governments. Unfortunately, even as millions of people come to depend on social services in tough times, trust in the government has hit historically low levels. To restore faith, it would thus be highly useful for government officials to have the tools they need to ensure that every dollar is spent appropriately and transparently.
Surprisingly, though, the software for managing and analyzing government spending has lagged behind, especially at the local level. Answering even seemingly simple questions about government budgets can often be onerous, involving object queries into aging database systems or manual searches through PDF documents or spreadsheets. Many local governments use enterprise accounting systems or ERP systems written 30 years ago. This often means that a city manager who wishes to determine how much is spent on a particular line item must ask his or her IT or finance personnel to run customized reports and wait for the answers. Elected officials, for their part, often need to ask managers, who in turn need to ask other executives, who often need to ask analysts. Needless to say, this means a distinct lack of visibility into the thousands of line items that constitute a typical government budget.
This causes problems on multiple levels. It is a problem for government executives, who must wait to get data to make critical decisions. It is a problem for department heads, who need to operate to budget, forecast future budgets based on historical spending, and spot issues before they become problems. It is a problem for government IT staff, who are increasingly stretched thin as budgets flatline or shrink. And, ultimately, it is a problem for democracy, as citizens and legislators alike cannot make truly informed decisions without access to the right data.
Where OpenGov comes in
The origins of OpenGov were in the Great Recession; in the wake of the financial crisis, everyone – local governments included – found it imperative to get a handle on their finances to determine which line items were absolutely necessary, what revenue was sure to come in, and just how much red ink they might expect in the next fiscal year. The OpenGov founders decided to address this problem by starting locally, beginning by sitting side by side with the city government of Palo Alto to build reporting software. This resulted in the first version of OpenGov, a web-based interface for the Palo Alto government to see their expenditures and communicate them to the public. The demo of that early product was forwarded widely around California state government, and the positive response told the OpenGov founders that they had indeed created something useful.
Today, the OpenGov platform has grown to become a tool for more than 150 governments to analyze more than 50 billion dollars in annual spending. Each government’s custom website (like http://losangeles.opengov.com) is like a Mint.com for government spending. A government finance director or IT manager need only upload a general ledger and chart of accounts to generate an interactive visualization of past, present, and projected future spending.
Governments use OpenGov internally to create custom reports, help operations manage to budget, keep senior executives and legislators maximally informed, and help with important workflows from the budgeting process to internal audits. And they use it externally to publish interactive budgets, share this information with the community, and even achieve revenue goals by disseminating important financial data around tax or bond measures.
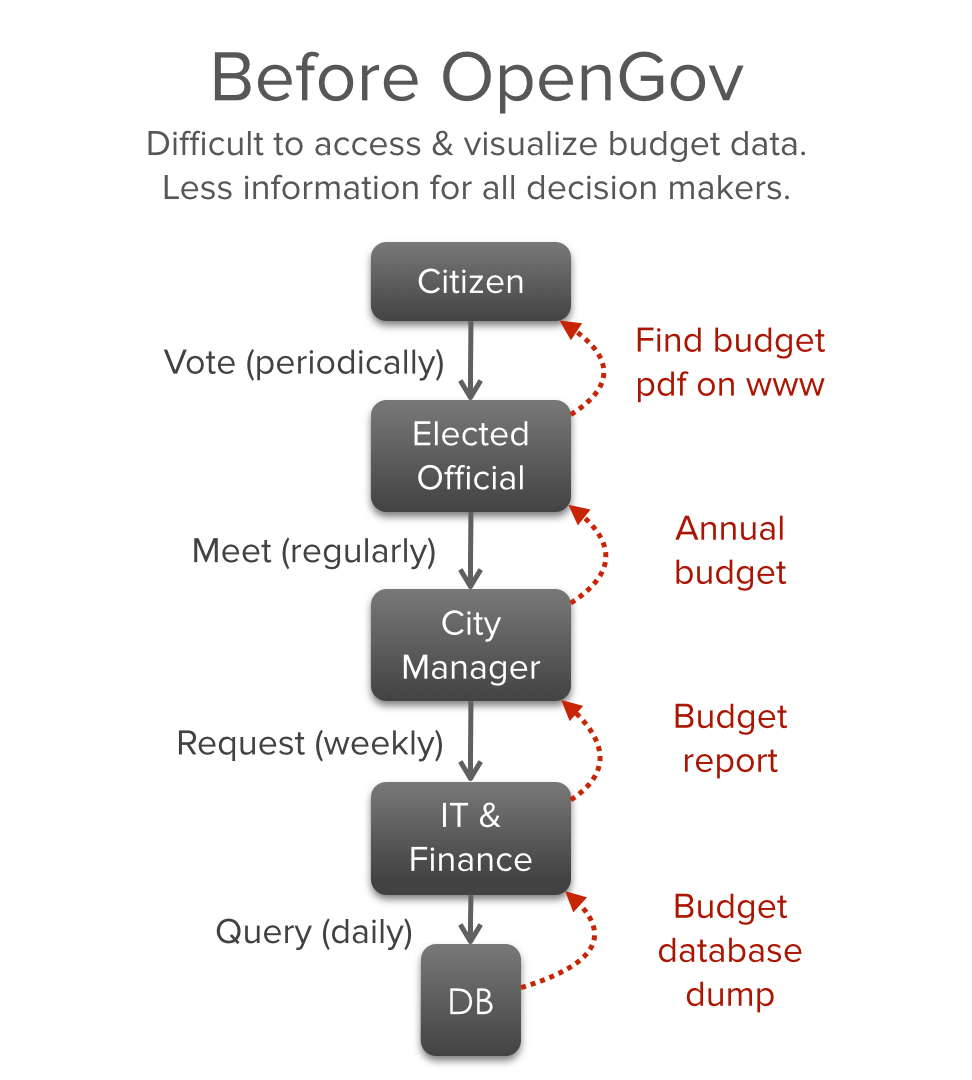
Before OpenGov, getting granular information of this kind on a budget required reading PDF documents or running the aforementioned custom reports prepared by scarce IT or finance personnel. For a government executive, it was a bit like working with a search engine limited to a few queries per week.
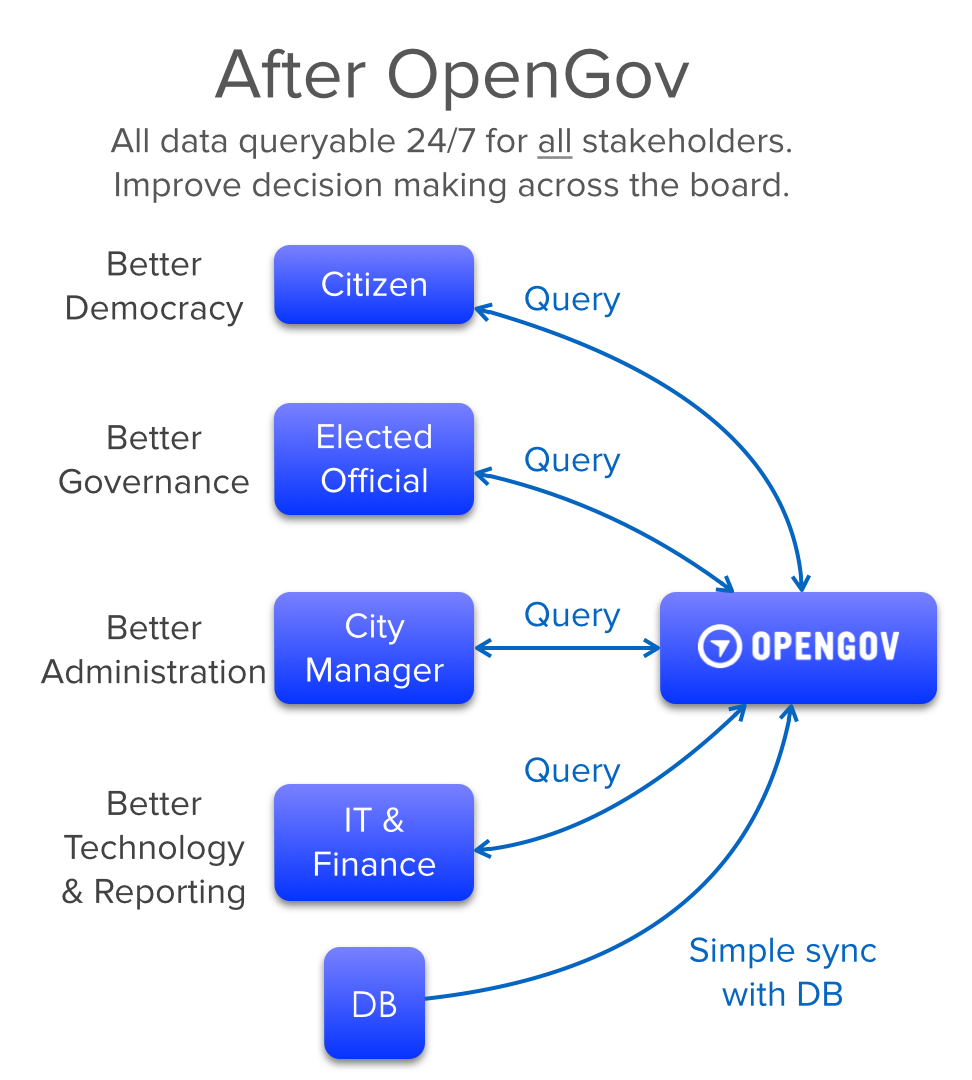
However, by simply pulling the data into a standard format and putting it online, OpenGov has transformed the way that four groups of people — government executives, elected officials, government IT personnel, and ordinary citizens — can interact with their government’s budget:
Government executives can achieve better administration. Government executives use the opengov.com interface to figure out how to optimize services, without burdening their IT staff with a special case report for every query. Over time, they will be able to share notes and models to compare their budget decisions with managers of comparably sized cities and jurisdictions.
Elected officials can achieve improved governance. Officials like LA mayor Eric Garcetti are already using OpenGov to showcase to the public what tax dollars are doing for the community. Links to relevant budget line items or breakdowns can now be easily included in press releases, Twitter feeds, and public announcements.
Government IT personnel get the latest technology. IT personnel can now save valuable staff time by simply putting government budget data into a consistent format and uploading it into a web-based SAAS interface. Features requested by one government can also be rolled out to many comparable governments, saving enormous amounts of repeated work.
Citizens can gain greater participation in their democracy. Last but certainly not least, citizens can use OpenGov to interactively explore budgets and participate in an informed way in the democratic process.
While technically public, much of the data now indexed by OpenGov was locked in static PDFs and therefore not amenable to interactive visualization. The result is something like the leap from dusty card catalogs to a “Google for government.”
What we’ve found out so far…
Now that OpenGov has been adopted by governments and city managers across geographical and political boundaries, we can discuss some of the results we’ve found in our initial deployments.
To simply clean and aggregate data can produce miraculous insights. Within the technology community, there is much (justified) excitement about tools for analyzing big data. In many domains, however, it’s not so much about “big data” yet as it is about “clean data.” Within the context of government spending, simply aggregating data, cleaning it up, and making it globally visible provides a tremendous amount of value. In particular, the aggregation that OpenGov has performed makes it possible for the first time for governments to easily compare their spending profiles against counterparts of similar size and demographics.
Transparency is a non-partisan good. There’s a reason that both Ralph Nader and Grover Norquist both support increased transparency in government spending. From Norquist’s perspective, you can’t cut what you can’t see: visibility allows one to identify monies being spent suboptimally. From Nader’s perspective, you can’t claim what you can’t see: increasing taxes becomes easier once the public has evidence that government funds are being spent on popular services, like roads and firefighters. OpenGov is apolitical in its mission, and both of these goals are served by simply providing insight into where the dollars are going.
OpenGov solves the Catch-22 of “limited budget for understanding the budget”. Because local government budgets are tight, it’s more important than ever to find out where the dollars are going. Yet because local government budgets are tight, it’s often difficult to find new resources for software engineers and data scientists. OpenGov solves this Catch-22 by making it extremely inexpensive to upload local government data into a cloud service and get started with visualizing budgets. Because information is valuable to the extent that it is actionable, information that increases the efficiency of government spending by even a few basis points can save millions of dollars annually – and easily recoup the cost of the OpenGov software.
In the near future, OpenGov will be launching a platform for government executives to find the lowest cost vendors, to identify comparable governments, and to collaborate with other government officials on the annual budgeting process. In the long term, the goal is simple: make cutting-edge business intelligence and collaborative reporting software easy to use for the largest industry in the world.
The incredible thing about OpenGov is that at $50 billion in annual customer revenue, it’s just getting started. With room for more than 100X growth in just the U.S. alone, the future is bright. And as OpenGov provides tools for local, state, and federal officials to find a billion here, and a billion there — soon we’ll all be saving real money.
