Tune into any cable network stock market channel and the airwaves resonate with one consistent theme: SaaS companies are simply too expensive. In fact, we might even be in a bubble!
The argument goes as follows — high revenue growth coupled with lack of profits means these businesses are fundamentally broken. Just as we saw in 1999-2000, investors’ willingness to pay for growth at any cost will end and many SaaS companies will be left behind.
But that line of reasoning conflates the lessons of the 1999-2000 tech bubble. The businesses that failed in the last tech bubble were valued on metrics that were both poor indicators of business health (“eyeballs”, anyone?) and were nowhere to be found in generally accepted accounting principals (GAAP). In contrast, SaaS companies can be properly valued based on metrics that are both good indicators of financial health and that can be tied directly to the company’s GAAP filings.
So why do the pundits have it all wrong? Because we love the simple income statement narrative that makes for great headlines, and we have trained the world to judge company performance based on revenue and earnings per share. Sure, it’s simple and, to be honest, it’s also accurate for a vast majority of publicly traded companies.
When it comes to SaaS, however, such simplicity can lead to bad investment decisions. Here’s why.
The key difference between traditional software and software as a service: Growth hurts (but only at first)
In the traditional software world, companies like Oracle and SAP do most of their business by selling a “perpetual” license to their software and then later selling upgrades. In this model, customers pay for the software license up front and then typically pay a recurring annual maintenance fee (about 15-20% of the original license fee). Those of us who came from this world would call this transaction a “cashectomy”: The customer asks how much the software costs and the salesperson then asks the customer how much budget they have; miraculously, the cost equals the budget and, voilà, the cashectomy operation is complete.
This is great for old-line software companies and it’s great for traditional income statement accounting. Why? Because the timing of revenue and expenses are perfectly aligned. All of the license fee costs go directly to the revenue line and all of the associated costs get reflected as well, so a $1M license fee sold in the quarter shows up as $1M in revenue in the quarter. That’s how traditional software companies can get to profitability on the income statement early on in their lifecycles.
Now compare that to what happens with SaaS. Instead of purchasing a perpetual license to the software, the customer is signing up to use the software on an ongoing basis, via a service-based model — hence the term “software as a service”. Even though a customer typically signs a contract for 12-24 months, the company does not get to recognize those 12-24 months of fees as revenue up front. Rather, the accounting rules require that the company recognize revenue as the software service is delivered (so for a 12-month contract, revenue is recognized each month at 1/12 of the total contract value).
Yet the company incurred almost all its costs to be able to acquire that customer in the first place — sales and marketing, developing and maintaining the software, hosting infrastructure — up front. Many of these up-front expenses don’t get recognized over time in the income statement and therein lies the rub: The timing of revenue and expenses are misaligned.
The income statement alone therefore can no longer tell us everything we need to know about valuing a SaaS business.
Even more significantly (since cash is the lifeblood of any business), the cash flow timing is also misaligned: The customer often only pays for the service one month or year at a time — but the software business has to pay its full expenses immediately.
Thus, as with many innovative new businesses, cash flow is a lagging not a leading indicator of the business’s financial health.
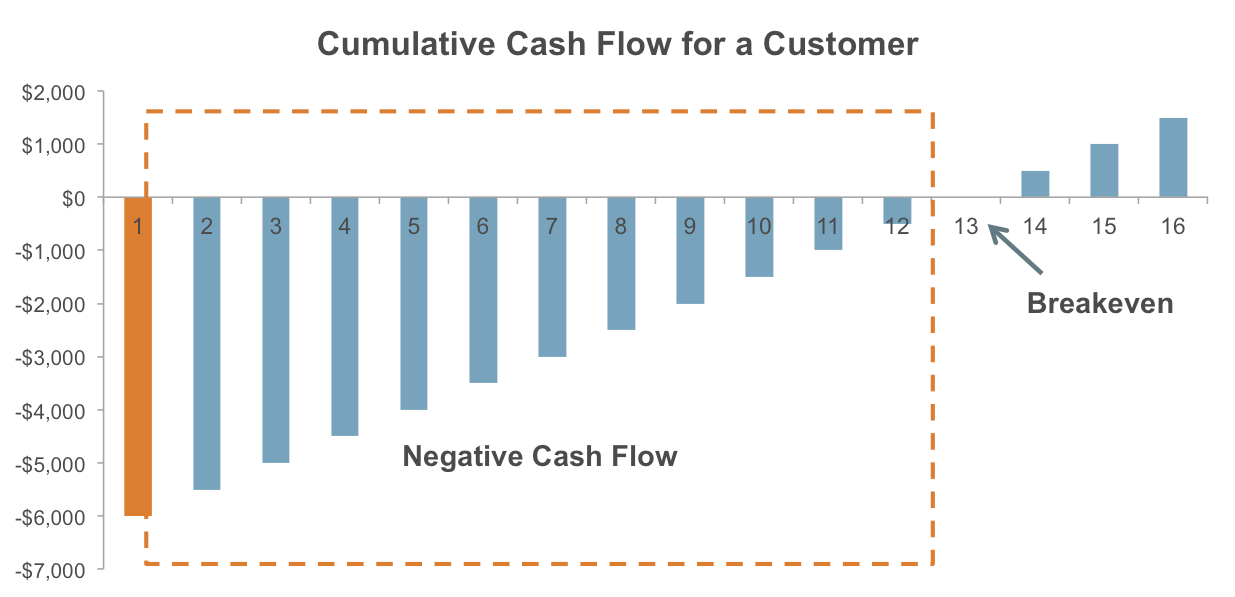
Take a look at the cumulative cash flow for a single customer under a SaaS model — the company doesn’t even break even on that customer until after a year:
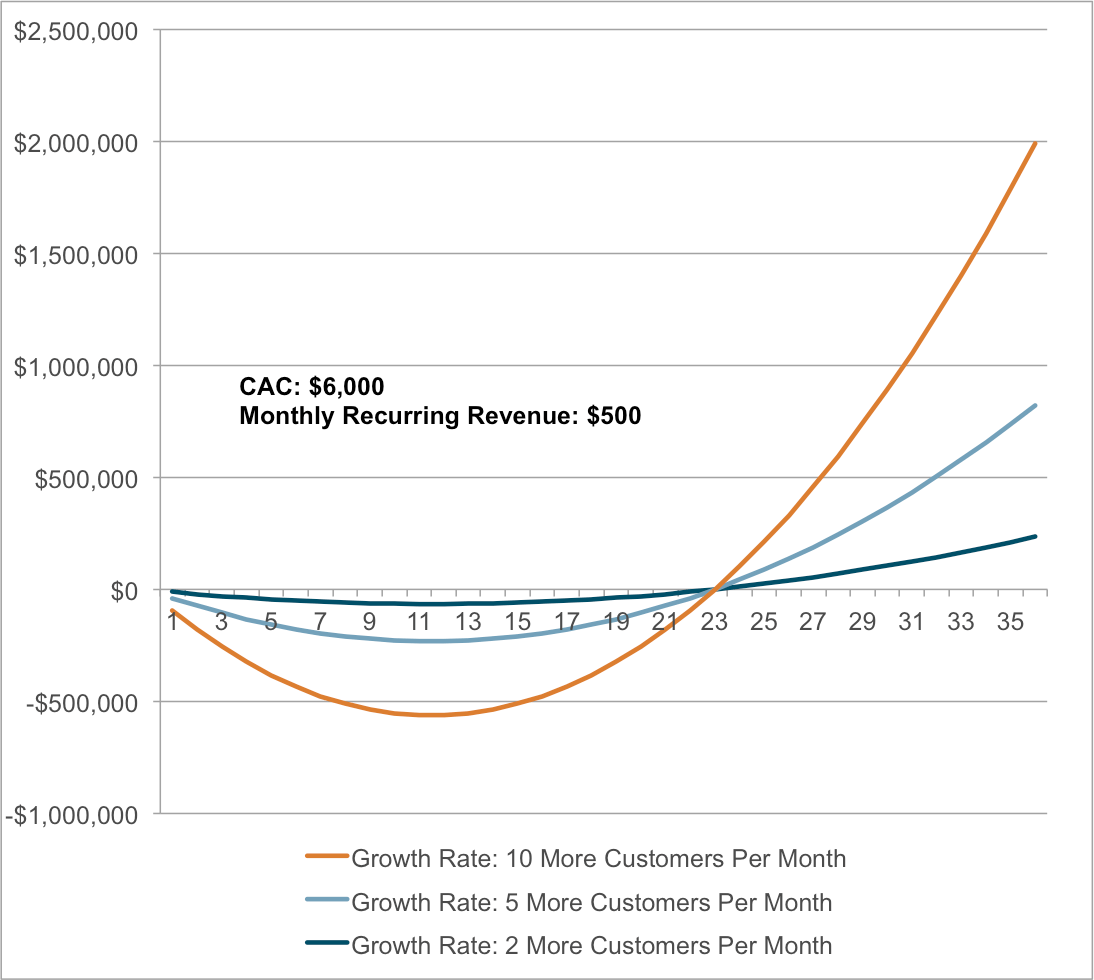
 And as the company starts to acquire more customers, the cash flow becomes even more negative. However, the faster the company acquires customers, the larger it grows its installed base and the better the curve looks when it becomes cash flow positive:
 The key takeaway here is that in a young SaaS business, growth exacerbates cash flow — the faster it grows, the more up-front sales expense it incurs without the corresponding incoming cash from customer subscriptions fees. (For a broader review of this phenomenon, please see David Skok’s “SaaS Metrics 2.0“).
So why would any rational person ever invest in a SaaS company?
Because once a SaaS company has generated enough cash from its installed customer base to cover the cost of acquiring new customers, those customers stay for a long time.
These businesses are inherently sticky because the customer has essentially outsourced running its software to the vendor, making them very predictable to model and more likely to yield high cash flows. Ultimately, we see the reverse of what we saw in the startup phase of the company: all the costs of acquiring that customer were incurred up front and long ago, and now the company gets to harvest nearly all the incoming cash flow from its customers as profits.
There is also a really interesting, but often overlooked, long-term cost advantage that SaaS companies have and that perpetual license businesses don’t: research and development.
In a perpetual license business, the R&D (and support) teams are often maintaining multiple versions of the software, with multiple versions running in the wild. Even Microsoft had to finally — 12 years later — deprecate its support for Windows XP, despite all sorts of customers from ATM operators to federal, local, and international governments mourning the loss.
This generally doesn’t happen in SaaS because all customers are running on the same hosted version of the software: one version to maintain, one version to upgrade, one version on which to fix bugs, and one physical environment (storage, networking, etc.) to support. Given that software companies at maturity often spend 12-15% of their revenue in R&D, this cost advantage is very significant and further enables SaaS companies to be even more profitable at scale — particularly if they use multi-tenant architectures. Not to mention that this simplified hosting and support model is the very linchpin for long-term SaaS customer success and retention, especially as compared to the buy-but-don’t-use “shelfware” behavior that characterizes perpetually licensed enterprise software.
But there are even more reasons why customers tend to stick to SaaS:
…It’s very difficult to switch SaaS vendors once they’re embedded into business workflow. SaaS customers, by definition, made the decision to have an outside vendor manage the application. In the perpetual license model, in-house IT staff managed all software instances and thus could incur the internal costs to switch vendors if they so chose.
…Budgets are much more decentralized now, because departments often adopt SaaS technologies and make purchasing decisions independent of the centralized IT organization. In the past, the top-down technology sales model made it very easy for a CIO to unilaterally replace application vendors.
…Because SaaS usage is at the departmental level, there are often many more users in a company than there have historically been from traditional software products, making switching costs even higher. In many cases, the departments forge an even closer relationship with their SaaS customer support rep than they do with their own IT.
This is why many SaaS companies today invest aggressively in sales and marketing when adoption is high, even though it puts pressure on current profitability. That early growth is key: In winner-take-all technology markets, it’s a land grab.
The real assessment for investors to make, then, is not whether current revenue and earnings per share multiples are too high — but whether we believe that the investments SaaS companies are making today (that by their very nature depress near-term earnings and cash flow) are being made appropriately and thus will result in true free cash flow generation over time.
How can we tell whether a SaaS business is healthy or not?
Given these dynamics, what’s an investor to do in assessing whether an early SaaS company will yield a good financial return? Thankfully, there are a few key guideposts.
We first need to measure Customer Acquisition Costs (CAC); the simple way to do so is to add up the quarterly sales and marketing expense for a company and divide that by the number of new customers acquired in the quarter. But how do we know if that CAC is worth it — or whether the company is simply spending too much money to acquire customers that will never yield a positive financial return?
To answer this question, we need to look at the lifetime expected earnings of that customer or Customer Lifetime Value (LTV), which is calculated by (Annual Recurring Revenue x Gross Margin) ÷ (% Churn + Discount Rate). As a general rule: if LTV is 3X or greater than CAC, that’s a good sign that the business model is working.
If the LTV is close to or less than CAC, then we know that something is out of balance; it suggests that the company is spending more money to acquire the customer than it expects to generate in profits over the customer’s lifetime. This could be because the company hasn’t figured how to effectively monetize its customers. Or that customers are leaving before they’ve spent enough money on the platform to cover the costs to acquire them. Or that the company hasn’t figured out an effective way to scale its customer acquisition costs. Whichever it is, you better investigate!
And then there’s the ultimate proxy for customer satisfaction — Churn.
Low churn equals happy customers; high churn means head for the exits. To add a nuance, though, we need to look at churn in relation to the rate of new customer additions. It’s the leaky bucket problem: as long as the hole (churn) is small, you can keep the bucket full by adding more water (customers) than is draining out.
There are two types of churn: customer churn and revenue churn. It’s important to look at them separately, as each teaches us something different about the health of the business. Customer churn is the % of total customers who churned in a given month or year. While this is a good measure to understand a company’s ability to satisfy and retain its customers, it is more telling to look at revenue churn, the % of revenue lost due to churned customers as a % of total recurring revenue.
If total churn equals the acquisition rate, then the amount of customers joining equals exactly the amount of customers leaving. Growth slows, and then stops. And so longer term, churn is perhaps most important to forward growth outlook — especially as the need to replace lost business greatly increases at scale.
There are several ways that a company can offset or overcome churn: add new customers at a faster and faster pace; have “negative churn” (which happens when expansion revenue is larger than the revenue lost from churned customers); and reduce churn itself — that is, retain customers! This is why marketing, sales, and customer management functions are so crucial to SaaS and why you will see SaaS companies invest in these areas ahead of the revenue.
Yet another reason why the income statement in the early days can be misleading.
The key thing to note here is that it costs less to maintain and grow an existing customer than to acquire a new one. That’s why SaaS companies burn near-term cash on customer management functions, because if done correctly, these investments will pay huge cash dividends down the line.
Finally, another important indicator of future growth and upside is unearned or deferred revenue. As mentioned previously, SaaS companies only get to recognize revenue over the term of the deal as the service is delivered — even if a customer signs a huge up-front deal. Where, then, does that “booking” go? In most cases, it goes onto the balance sheet in a liability line item called deferred revenue. (Because the balance sheet has to “balance,” the corresponding entry on the assets side of the balance sheet is ‘cash’ if the customer pre-paid for the service or ‘accounts receivable’ if the company expects to bill for and receive it in the future). As the company starts to recognize revenue from the SaaS service, it reduces its deferred revenue balance and increases revenue — so for a 24-month deal, as each month goes by deferred revenue drops by 1/24th and revenue increases by 1/24th.
A good proxy to measure the growth — and ultimately the health — of a SaaS company is to look at Billings, which is calculated by taking the revenue in one quarter and adding the change in deferred revenue from the prior quarter to the current quarter. If a SaaS company is growing its bookings — whether through new business or upsells/renewals to existing customers — billings will increase.
Billings is a much better forward-looking indicator of the health of a SaaS company than simply looking at revenue for two reasons: (1) Revenue understates the true value of the customer because it gets recognized ratably; and (2) Because of the recurring nature of revenue, a SaaS company could show stable revenue for a long time (just by working off its billings backlog) which could make the business seem healthier than it truly is.
Here’s an example
Let’s use a real company example to illustrate the application of these metrics. We’ve picked Workday, since this SaaS darling is frequently criticized as being over-valued. All financials are based on publicly available GAAP disclosures.
 As you can see, gross margins and operating margins have been steadily improving over the past three years. This makes sense: Workday is amortizing the significant operational costs of running the software and the R&D/account management costs of supporting the software against a larger customer base. More significantly, they are getting recurring revenue from customers whose CAC they incurred in prior quarters and thus are fixing some of the timing mismatch of revenue and expenses that we see at earlier stages of development.
CAC/LTV
Workday does not disclose customer acquisition costs, so the proxy we used to get to CAC was sales and marketing spend for new customers:
 At first blush, these numbers might be cause for concern — in raw dollars it is costing Workday more to acquire new customers. However, just looking at CAC in isolation isn’t very useful unless we can compare it to the customer LTV.
Again, since Workday does not disclose customer lifetime value, we estimate LTV using our formula from earlier. Because Workday does not disclose Annual Recurring Revenue or Average Contract Value, we use the average subscription revenue per customer as a proxy:
 Now we have a more complete picture — the ratio of LTV to CAC is greater than 3x and, more significantly, the LTV/CAC ratio is increasing over time as customers increase their annual spend with Workday. This is typical for SaaS companies.
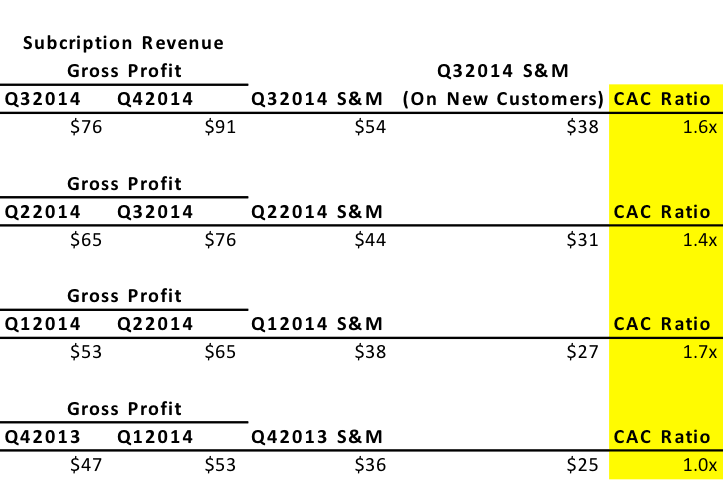
One other approach to assessing the cost of customer acquisition is to look at the CAC ratio. We calculate this by annualizing the difference in quarterly subscription gross profit from one quarter to the next and dividing that number by the prior quarter’s sales and marketing expense for new customer acquisition (again assuming 70% of sales and marketing expense in each quarter is allocated to new customer acquisition).
Essentially, this is telling us how long, in months, it takes for the company to get a full payback on its customer acquisition cost. For example, a CAC ratio of 1x means that it takes 12 months to get to break even. As a general rule, for companies that have low churn and high growth rates, anything 0.5x or higher (meaning a 24-month payback period) is considered good.
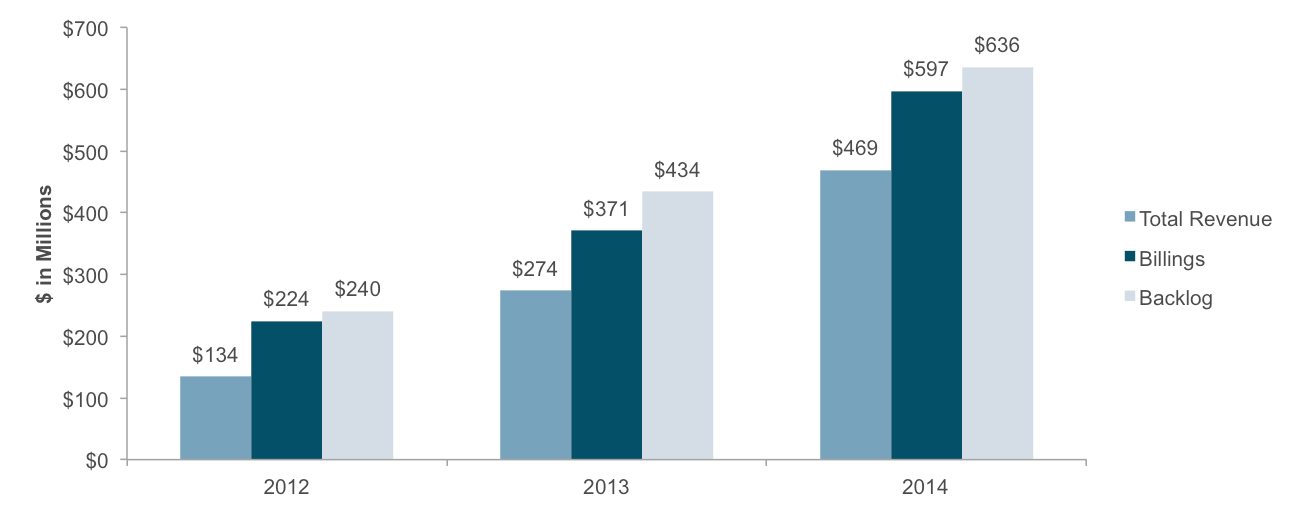
 Finally, let’s look at the health of Workday’s billings. Workday invoices customers for cloud applications contracts in annual or multi-year installments, and customers pay a portion of the total arrangement fee within 30 days of the contract date.
 Notice what jumps out here — in a growing SaaS business, revenue significantly understates the true financial performance of the business; for example, in 2014 alone, billings exceed revenue by $128 million. This shows how applying a simple revenue multiple to determine valuation can be rife with errors. Workday’s healthy billings growth (~60% in fiscal year 2014) suggests that the business still has substantial growth potential as it continues to win market share, which is precisely why investors are willing to pay a premium for the stock.
* * *
So, what should we make of all of this?
Well, if you believe, as we do, that technology markets tend to be winner-take-all, the leaders in any given category will get an unfair share of the overall economic pie.
True, not every SaaS company deserves the benefit of this doubt. But for category-leading companies going after huge markets with business models that demonstrably scale, we shouldn’t let the headlines get in the way of a great story.


