The leading AI companies don’t necessarily have a retention problem. But they do have a measurement problem.
Many self-serve or month-to-month billing AI products blur the lines between consumer and business use cases, making benchmarking retention tricky. And with the surge of AI tourists who sign up and churn after a couple months, early curves aren’t as indicative of long-term retention as they may have been for SaaS and consumer internet companies.
After analyzing hundreds of AI companies, we found that rebasing retention and customer acquisition calculations from Month 0 (M0) to Month 3 (M3) allows founders to better understand early indicators of long-term retention, evaluate product-market fit, predict unit economics, and make better go-to-market investment decisions.
We think that the leading AI companies may one day have even better long-term retention than their SaaS and consumer internet counterparts as products improve and capture the value of services workloads.
To illustrate, let’s walk through the curve dynamics.
Breaking down AI retention curves
To examine how new AI growth dynamics impact retention, we pulled retention numbers from dozens of top-performing AI companies and standardized them to total revenue retention reporting. We found that cohorted revenue retention breaks down into distinct sections: acquisition (M0–M3), retention (M3–6-9), and expansion (M9+).
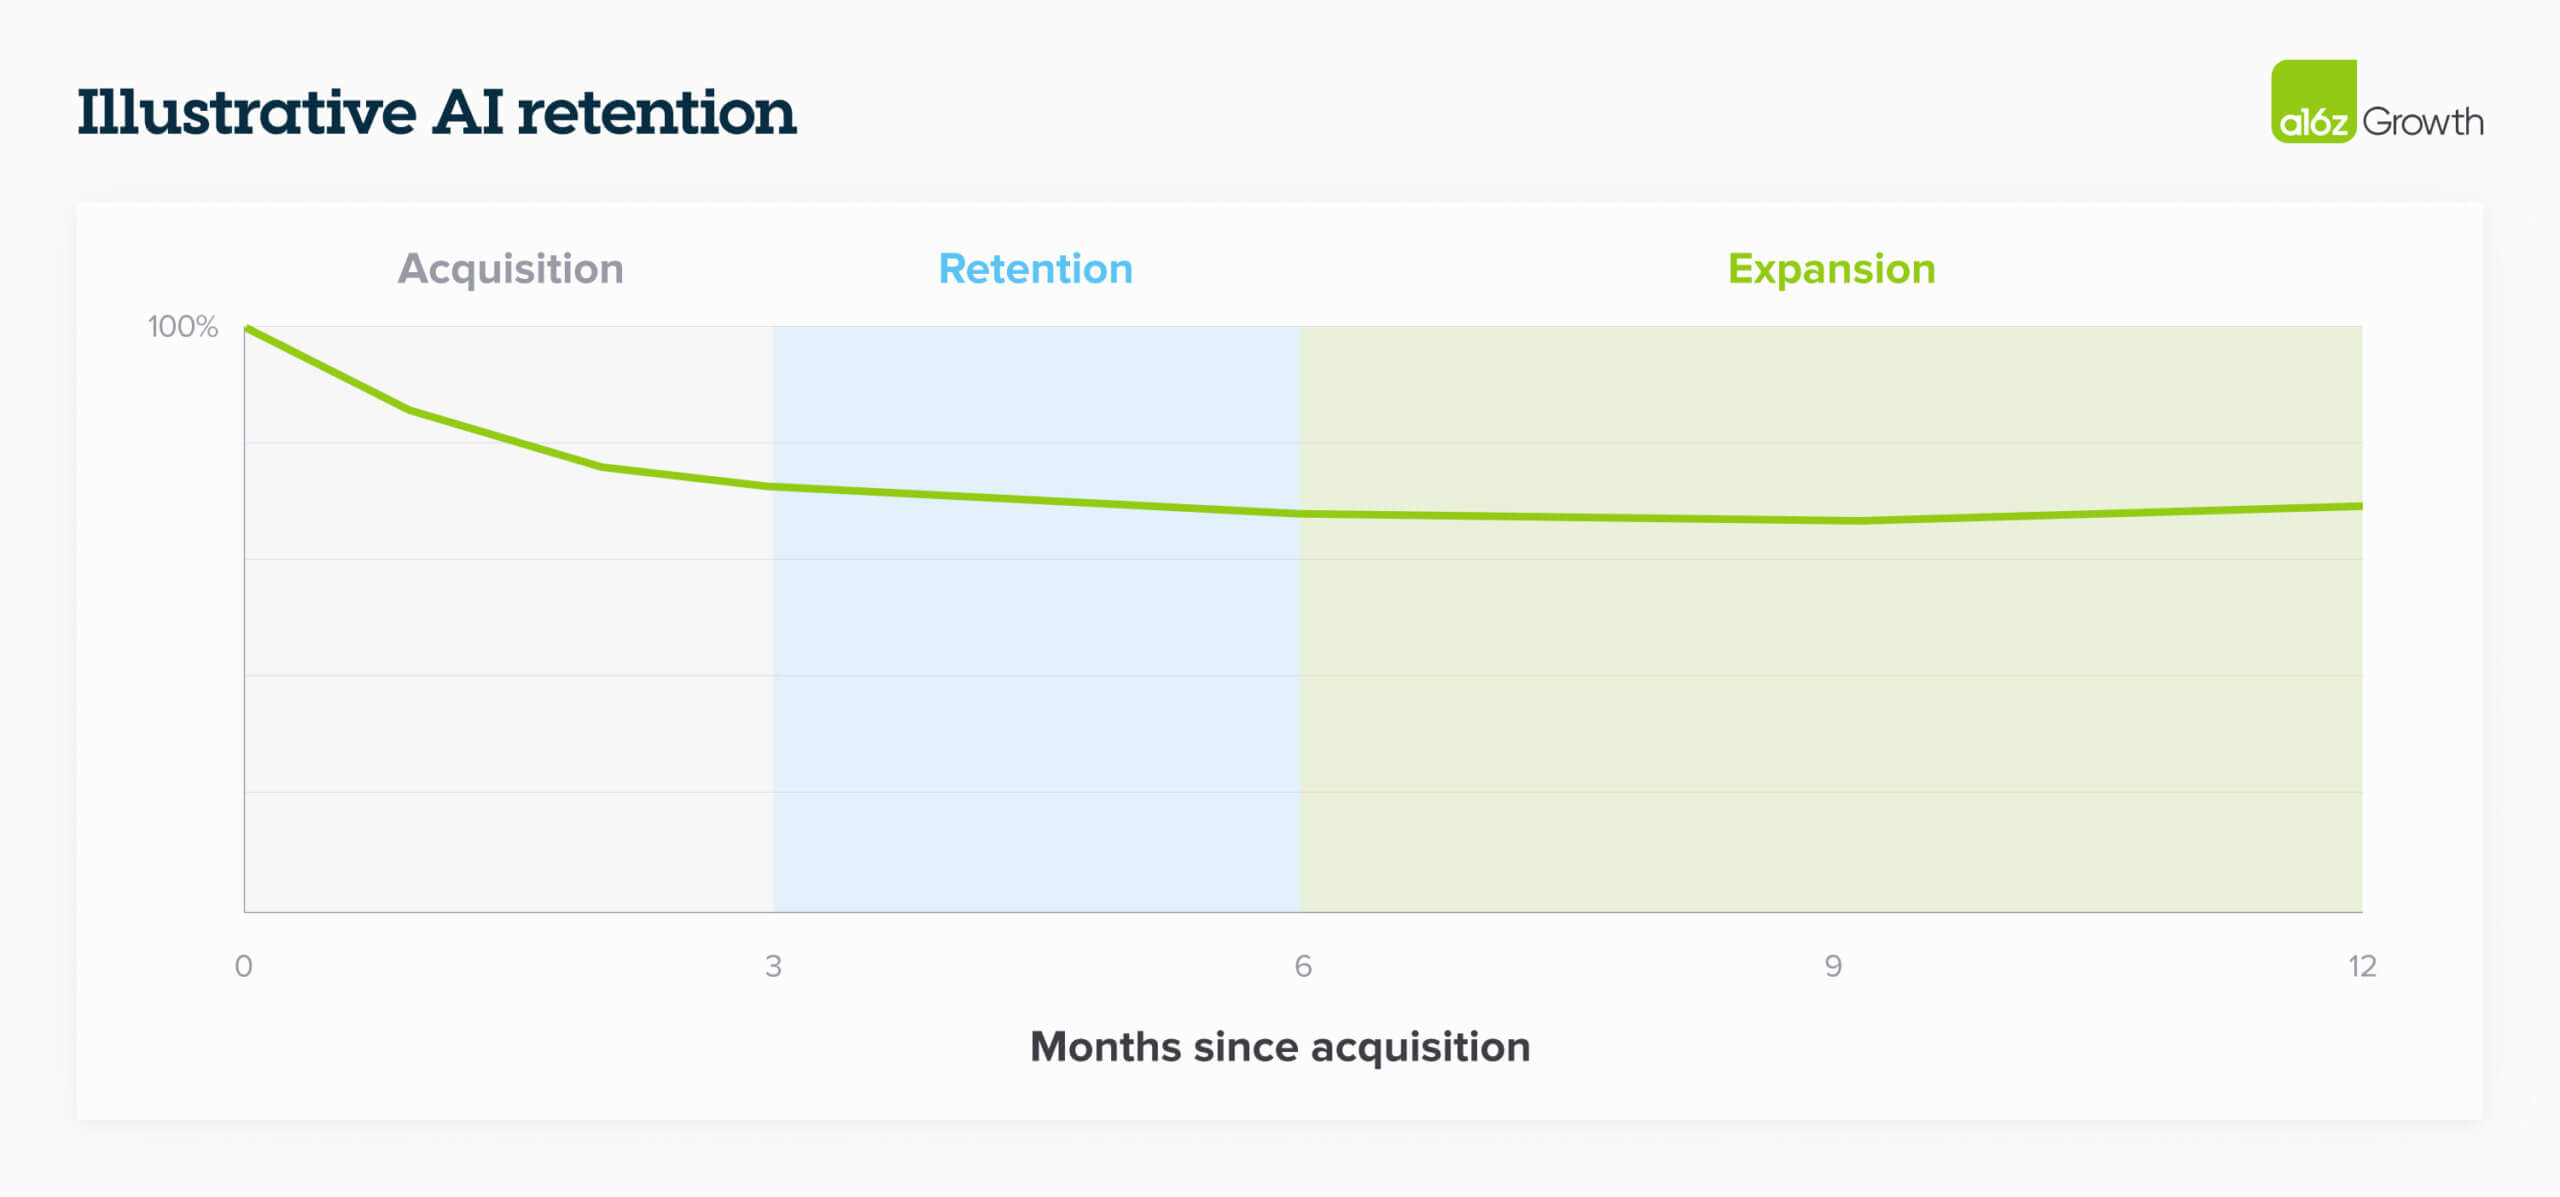
Acquisition (M0–3)
Retention has historically been anchored to new user sign-up or activation, which is Month 0 (M0) or Month 1 (M1). Given the AI tourist surge, revenue retention curves will typically see an initial drop-off as companies churn through acquired non-core or hobbyist users. Where and when curves begin to flat-line depends primarily on (i) how broadly applicable the application is and (ii) how the company decides to paywall the product.
Most often, the curve begins to flatten around M3. The exact timing matters less for long-term dollar retention—as long as the curve eventually flattens. It does matter for acquisition efficiency, though (more below!).
Broadly applicable products attract more hobbyist behavior, especially if they’re cheap—most addressable users will pay $20 to try something for a month. Products with tight paywalls attract many paying users who will quickly churn if they don’t see immediate value. Conversely, products with generous free tiers will see that customers who convert to paid are likely to retain better, showing higher M3 retention.
Retention and expansion (M3–12+)
Once a cohort has started to flatten (we say M3), hobbyists have mostly churned out and left companies with users who’ve identified high-impact use cases, experience ongoing value, and decided to continue investing in the product over trialing competitive offerings.
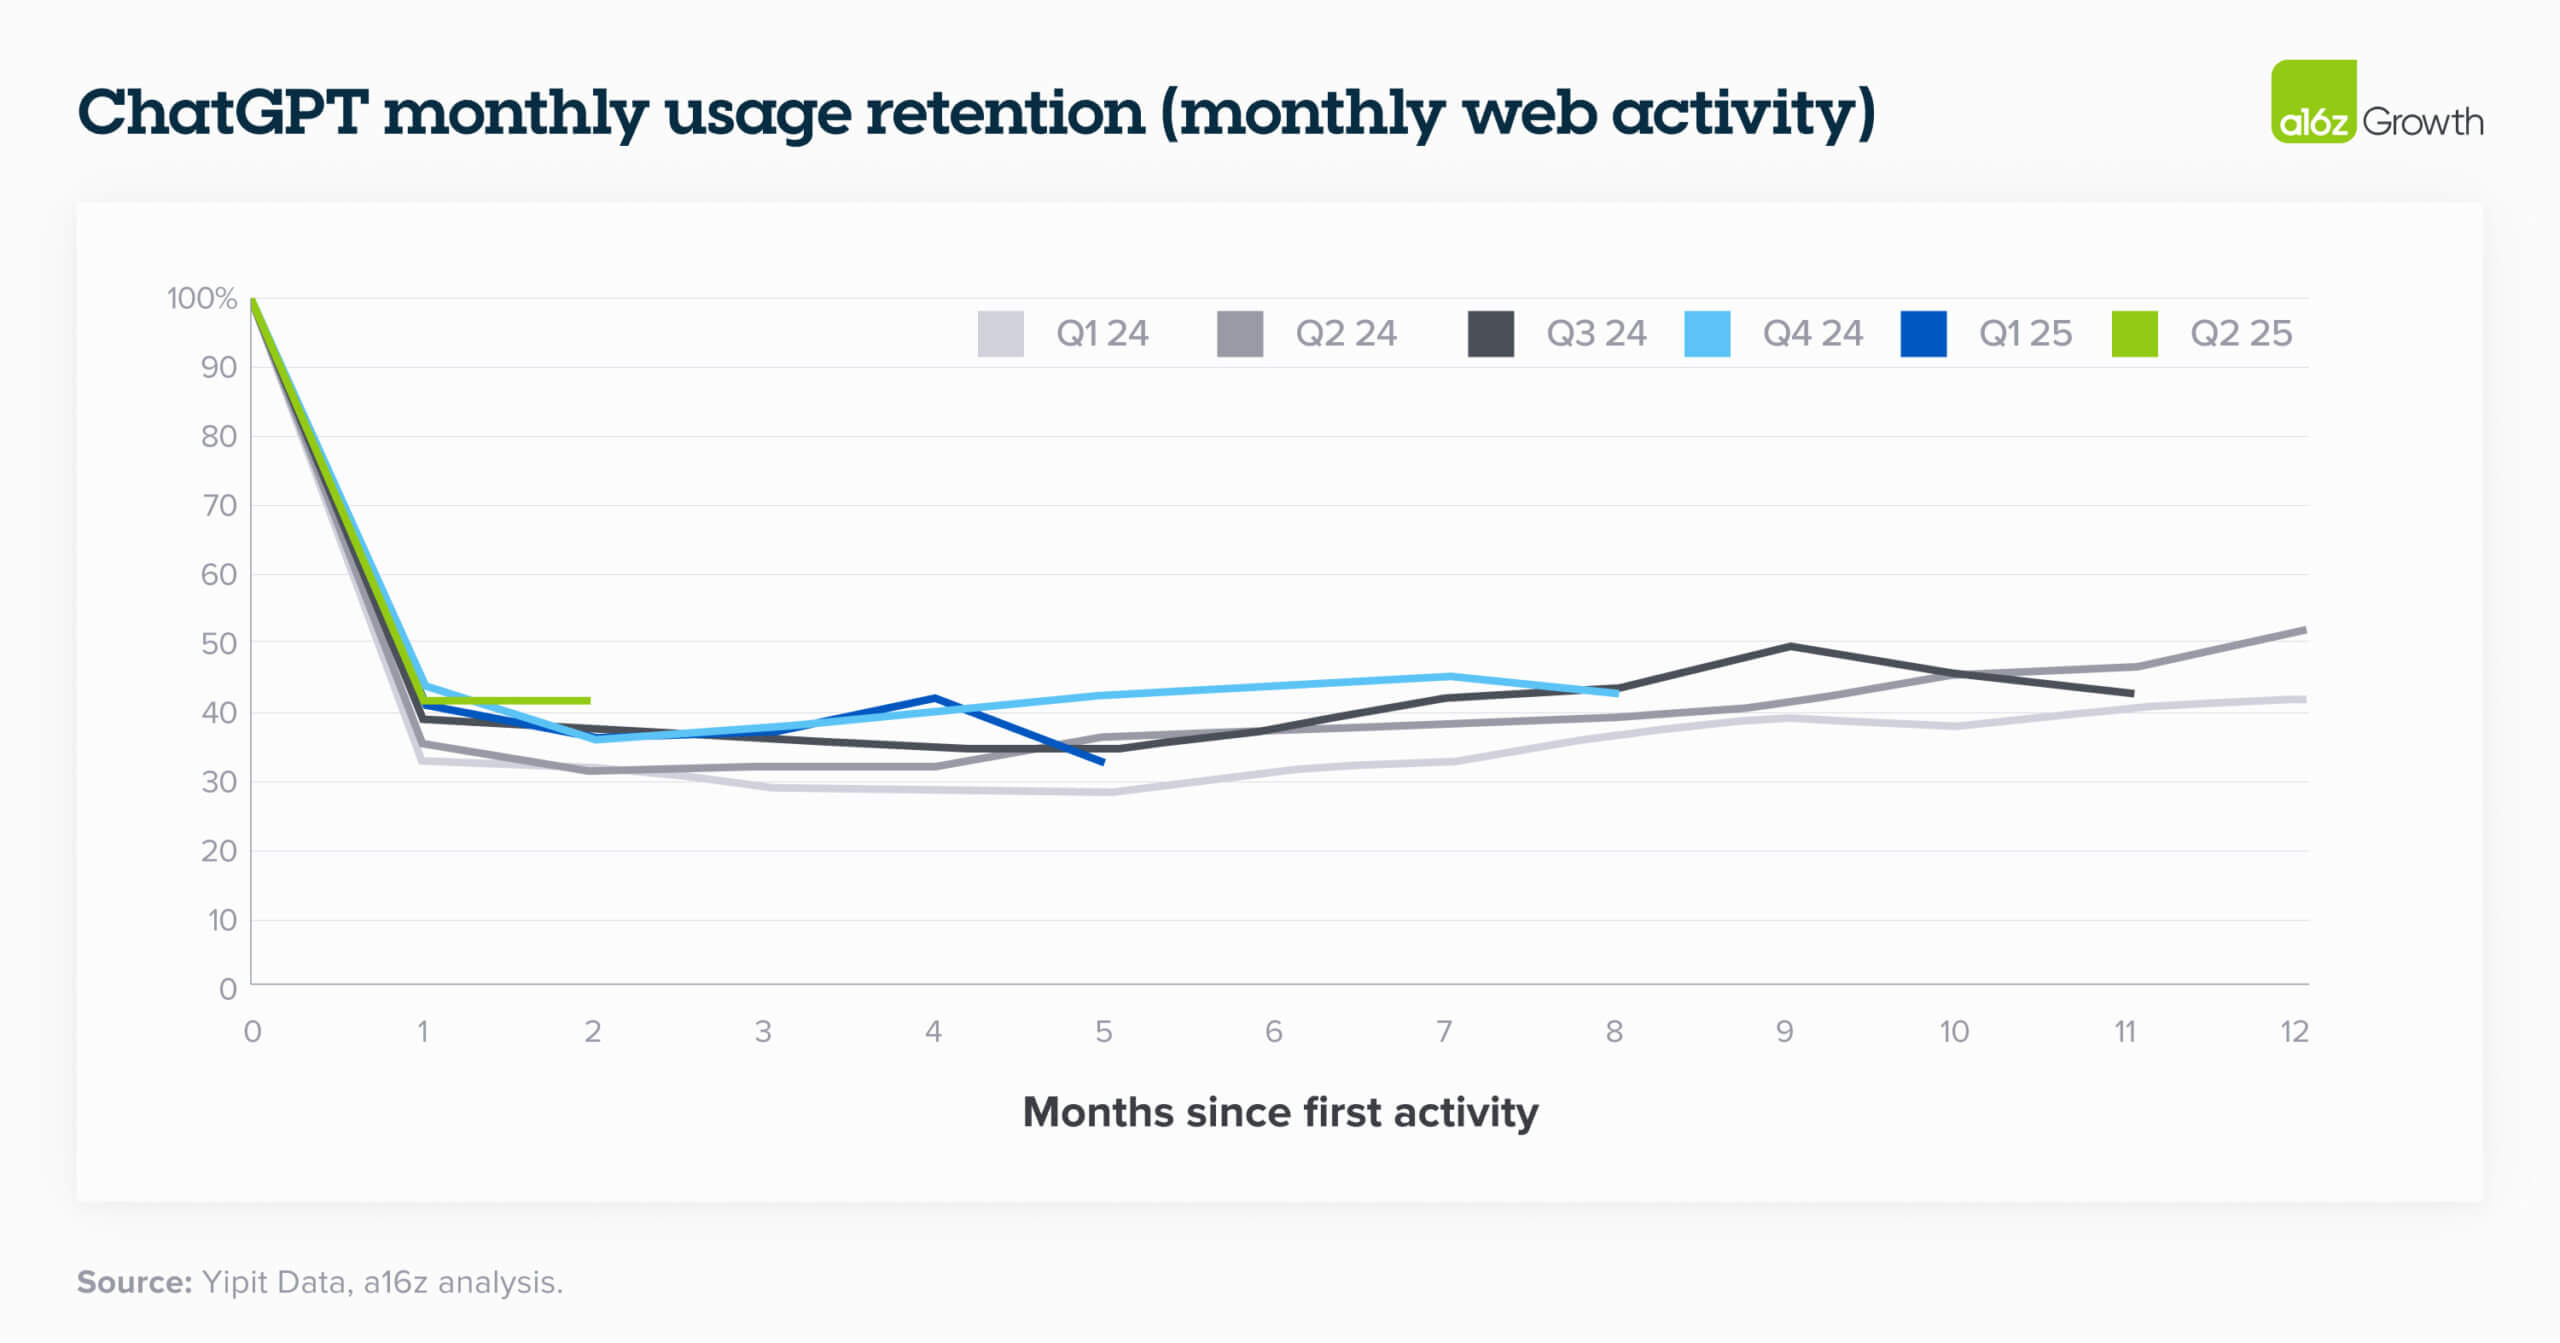
After ~6–12 months, retained customers may start expanding, usually by adding in new workflows that companies can monetize through usage-based pricing and/or trialing additional new products. A rare phenomenon that we’re seeing in AI-native companies is a “smiling” customer retention curve, which indicates that churned or lower-usage customers come back or use the product more often as the product’s capabilities improve. ChatGPT’s retention curve is the perfect example of this behavior. (We’d probably see even more of a smile if we accounted for app usage, too!)
Putting it all together: M12 / M3
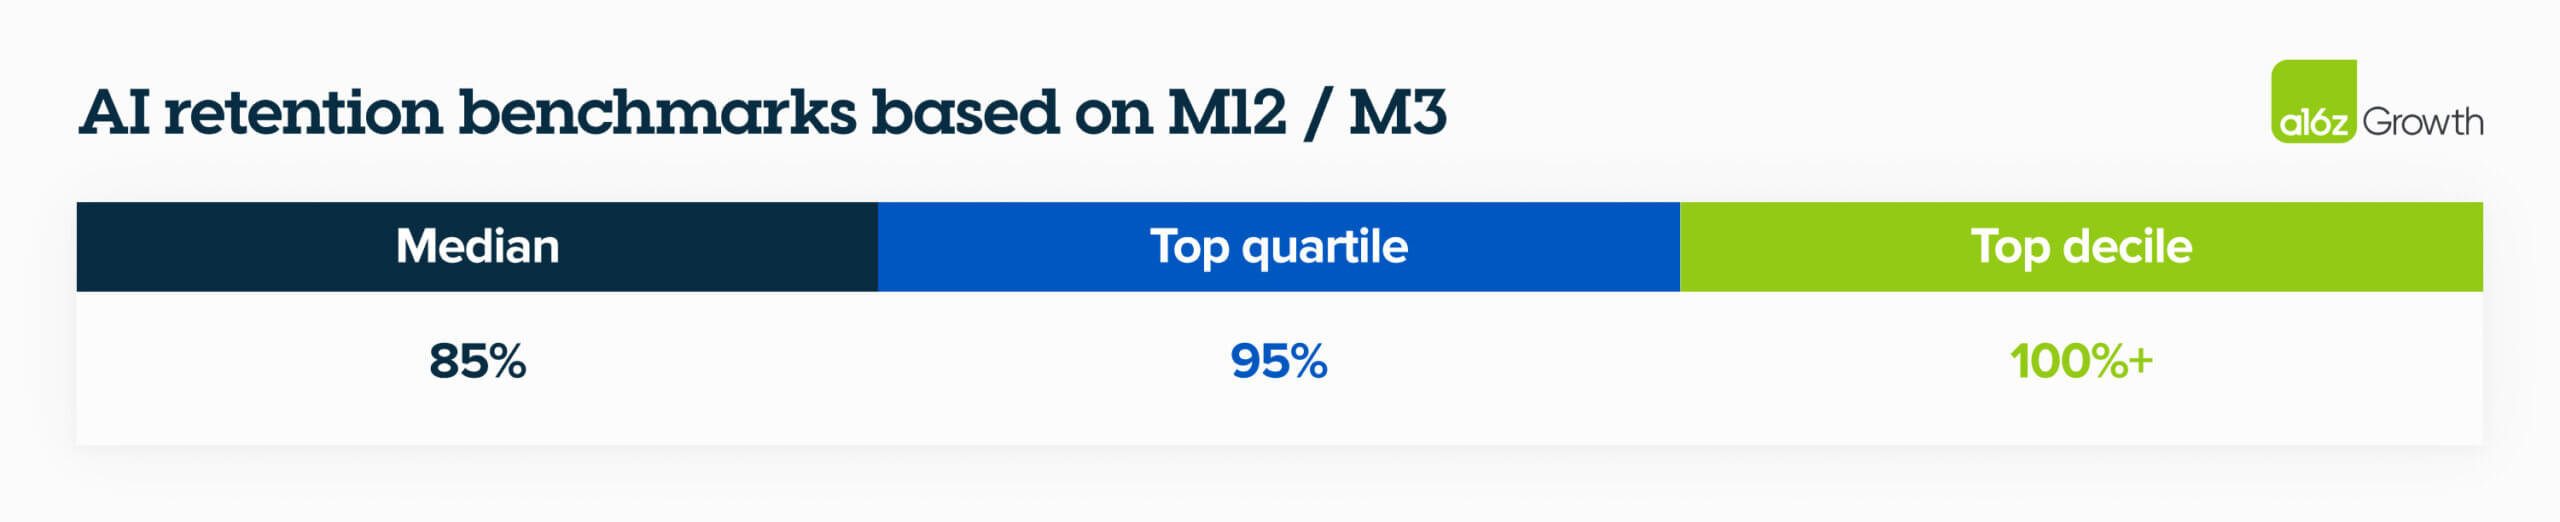
Here’s where our new formula comes in: M3 represents your ‘true’ customer base after AI tourists have churned out. M12 shows how these committed customers behave over a standard 1 year account. M12 divided by M3 measures how well customers who survive the tourist churn (M3) perform over their first full year and serves as an early predictor of long-term retention quality.
Industry-leading self-serve or month-to-month billing AI companies today already perform strongly on this basis, a leading indicator to >100% long term net dollar retention (NDR). Here are some benchmarks based on our dataset of dozens of AI companies we’ve seen with more than $1M of ARR.
What’s the impact of your retention curve flat-lining, then showing early signs of expansion? Extrapolating well past M12 shows how, over time, your reported NDR will asymptote towards the older cohorts. And even if you continue to have the initial drop-off in retention, the blended average will trend towards >100%, which is attractive even by historical SaaS benchmarks.
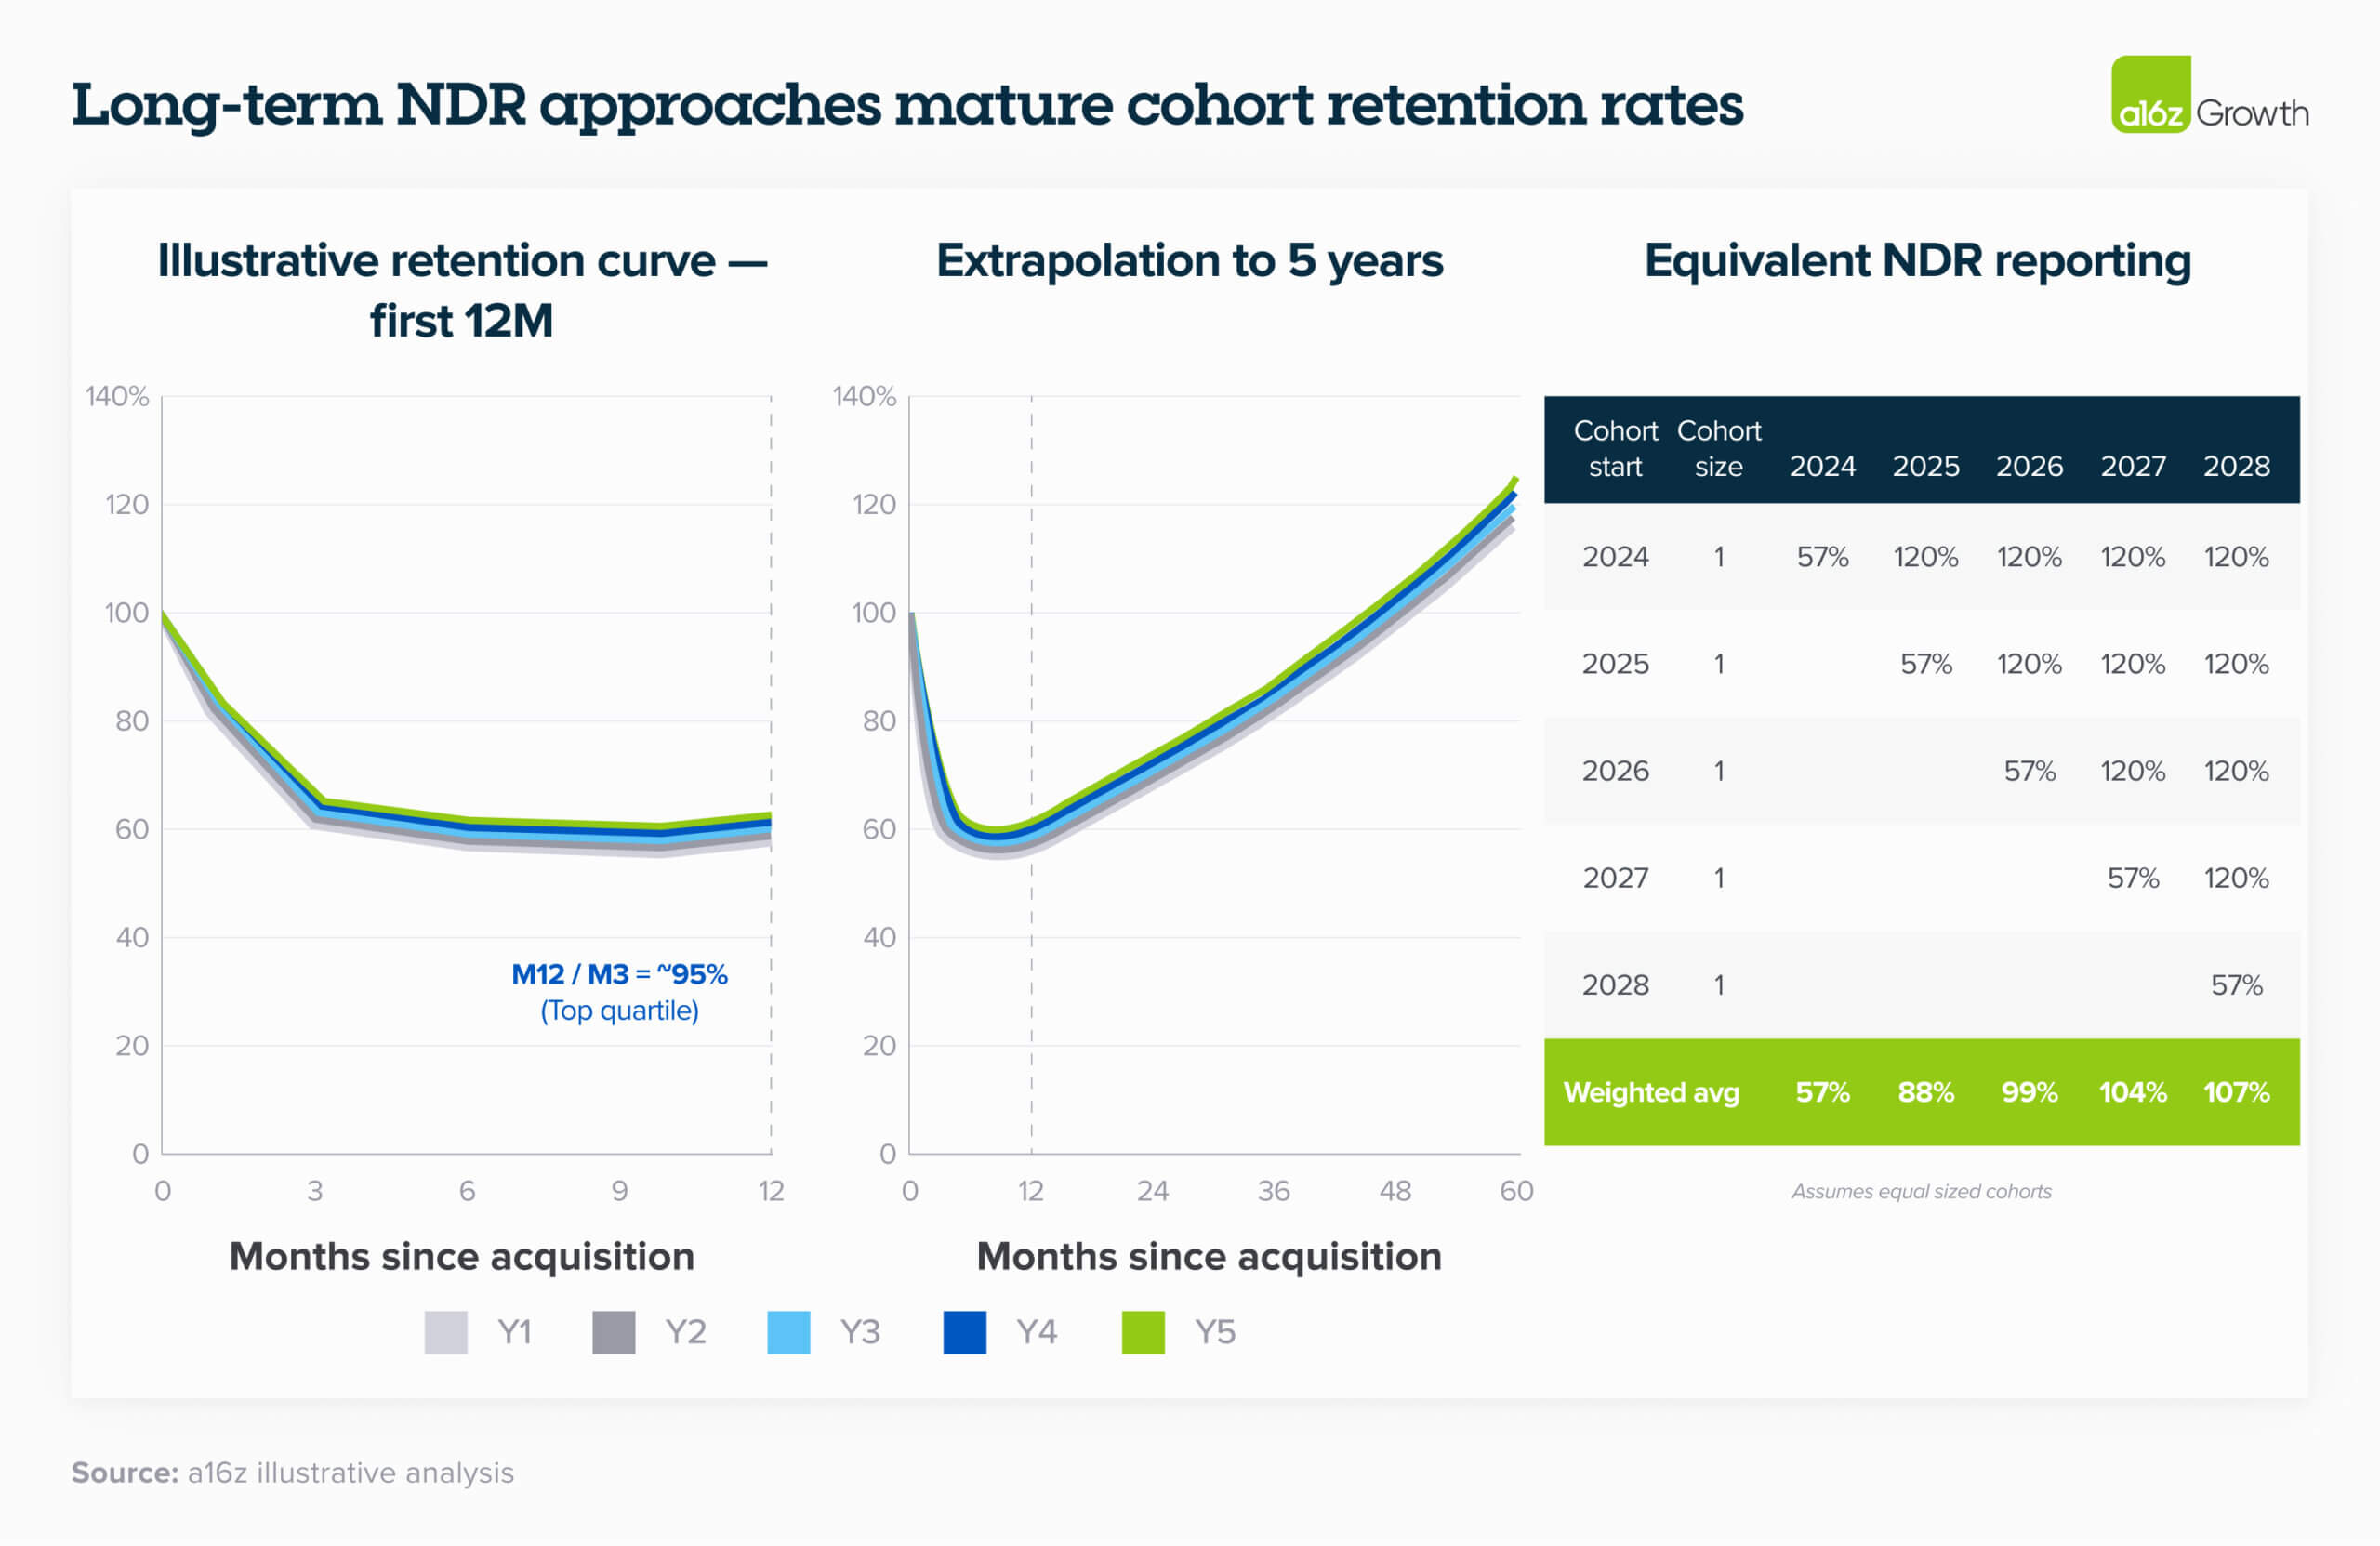
For example, let’s assume that your revenue retention curve flat-lines and begins to expand by M12. If we extrapolate retention beyond 12 months, we find that long-term retention may actually be much better than what people on X might suggest. As the table on the right shows, as the business mixes into its older cohorts (well into their expansion phase), the overall NDR profile as reported will be much better.
How to use this analysis
Measure product-market fit
Strong retention is a key signal that a product delivers ongoing, repeatable value. There is, however, some nuance in how to use retention to measure product-market fit based on how you bill.
For monthly contracts: use retention curves as a direct signal of product-market fit. Monthly customers can churn easily, so if they stick around past M3, you’ve likely built something with staying power.
For annual contracts: be careful about developing a false sense of security from high retention numbers, since these customers are locked in. Instead, track engagement metrics like usage patterns and feature adoption to understand the true value of your product. Initial usage will likely dip shortly after adoption, but as we’ve discussed, it should hopefully flatten and eventually tick up after several months.
Gut check for scaling go-to-market investments
When projecting 5-year LTV / CAC returns, retention is the most important input. Without strong retention, increasing GTM spend simply adds water to a leaky bucket. That’s why we track cost per retained customer at M3, which measures how efficiently GTM spend creates durable users rather than short-lived tourists.
If your retention curve continues to decline meaningfully after M3 and/or your retention doesn’t flatline at all, it’s a warning sign that initial customer delight isn’t translating into durable utility. If your curve stabilizes, you can predict unit economics more reliably and invest more aggressively in GTM. Plus, you can afford longer payback periods when you’re confident your customers will stick around.
This is just the beginning
As we’ve written with our colleague David George, retention is a core component of modelbusters, or companies that grow faster and for longer than anyone anticipated. As more AI companies have retention curves that start smiling, we may see retention rates far outpace anything we’ve seen in SaaS—driving compounding growth at scale, high margin potential at maturity, and ultimately, larger and more enduring companies than we’ve seen before.
Could we see 150% NDR at scale ($500M+ ARR)? For the first time, the answer might be yes.

