If you’ve lived in a country like the U.S. with a pretty stable currency, you probably think about how much things “cost” in seemingly absolute terms — of the currency. Things getting more expensive or less expensive comes down to whether it requires more of your currency or less of your currency. Gas got more expensive in 1980! Milk hasn’t really changed in a decade!
But — and this is not nearly as much fun or nearly as complex as the theory of relativity in physics — everything is relative.
Take the example of housing prices in the Bay Area. In the last decade, the median home price of $1.3M in Palo Alto has popped to $3.1M. If you look at prices as a function of the “gravity distorting” effects of technology stocks, however, it turns out housing has gotten much cheaper… that is, IF your base unit of currency is an index of tech stocks.
Why? When more dollars are “created” — through quantitative easing (aka “printing money”; amusing primer here) or surging valuation of stocks liquidated for dollars — the net result is that scarce assets become more expensive in relative terms, ceteris paribus. All other things being equal, it’s all relative.
This, by the way, is one of the causes of wealth inequality: Those with assets benefit when the quantity of currency rises. Those paid in the base currency — in regular wages, without being able to park savings in assets — do not.
That’s why fostering more ownership of assets is good for everyone. See the below for an interesting tracker that shows this, along with how correlated seemingly different assets are. There are no absolutes!
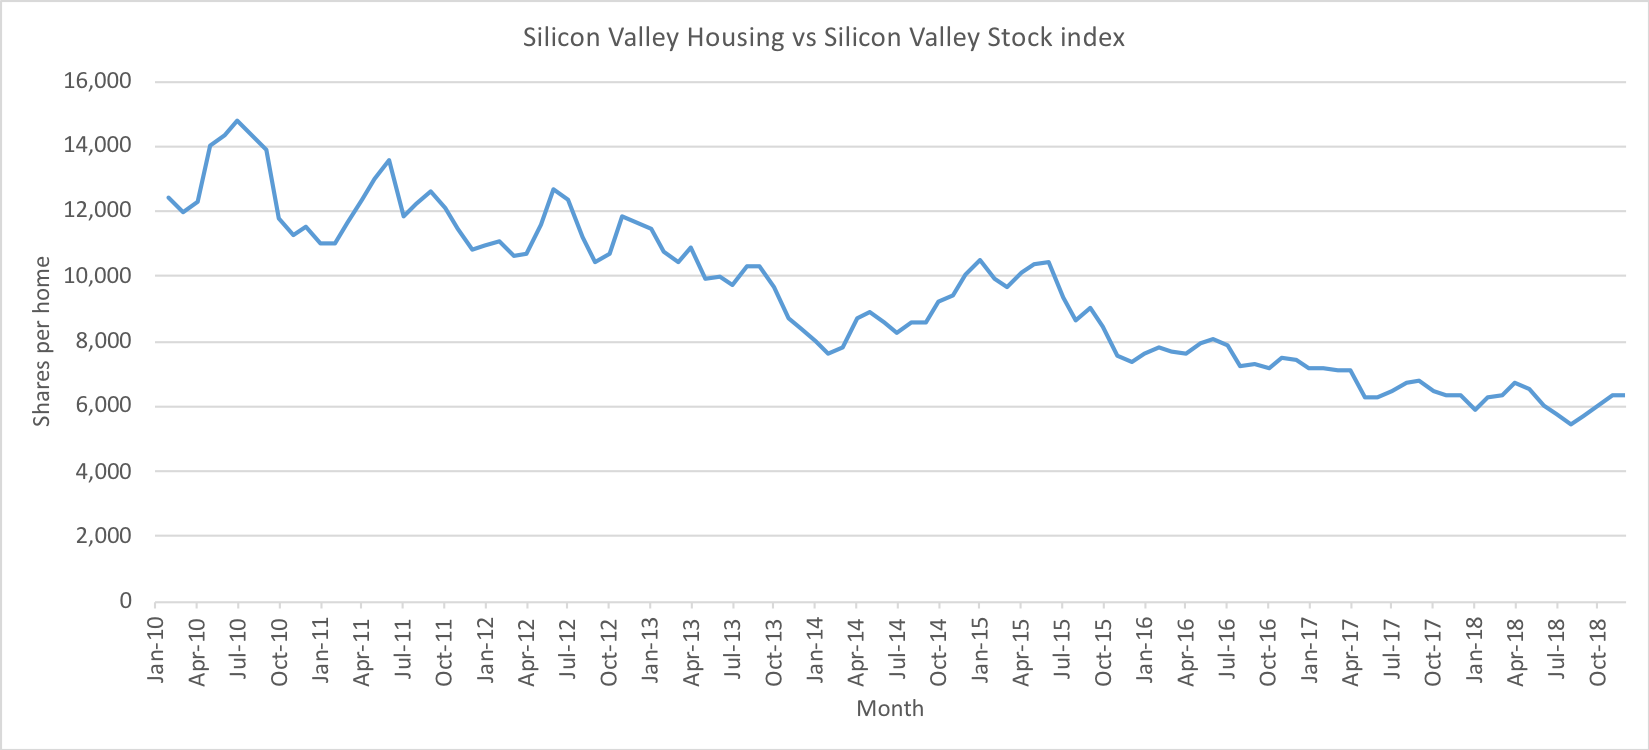
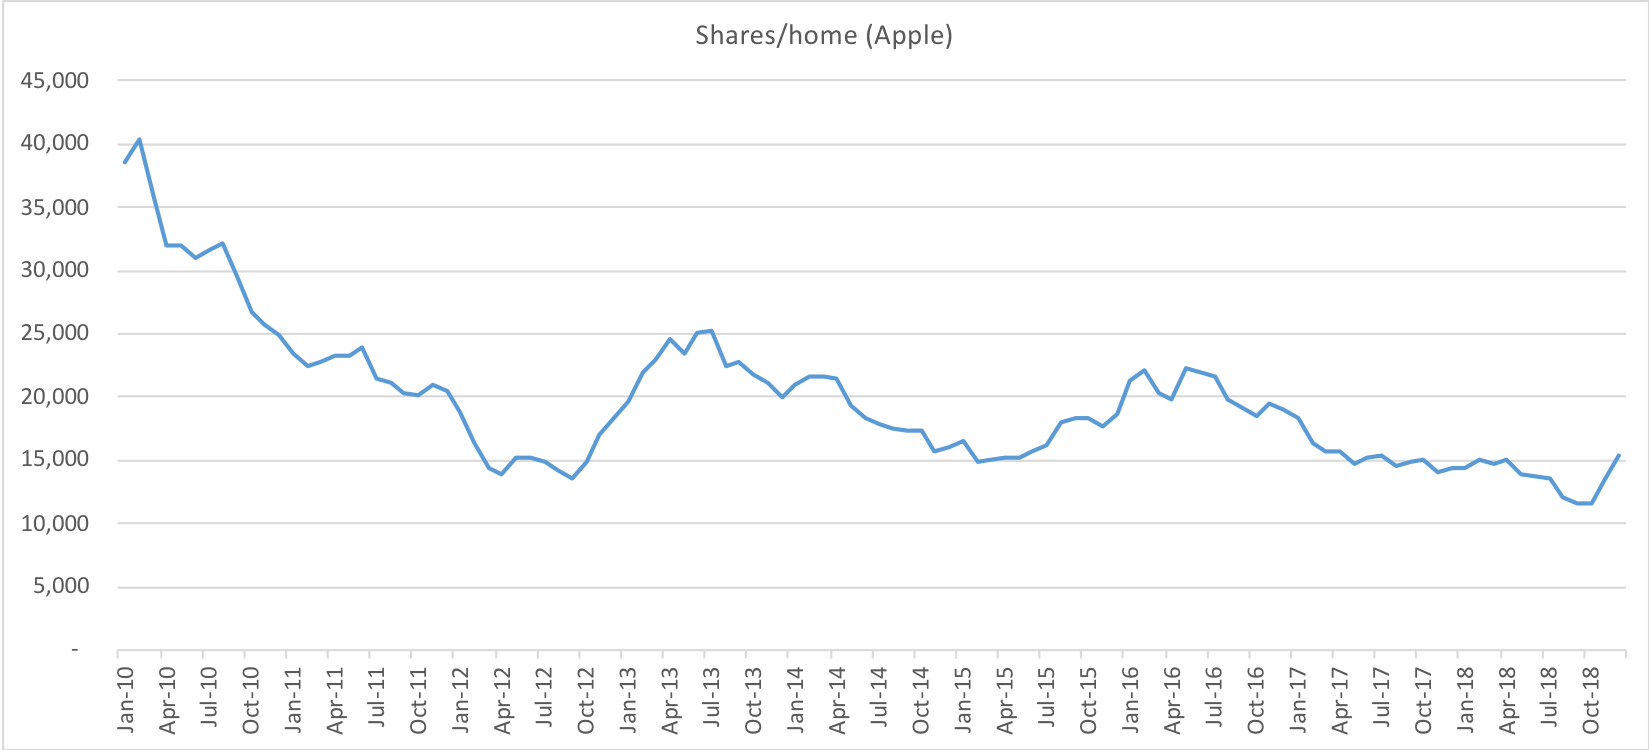
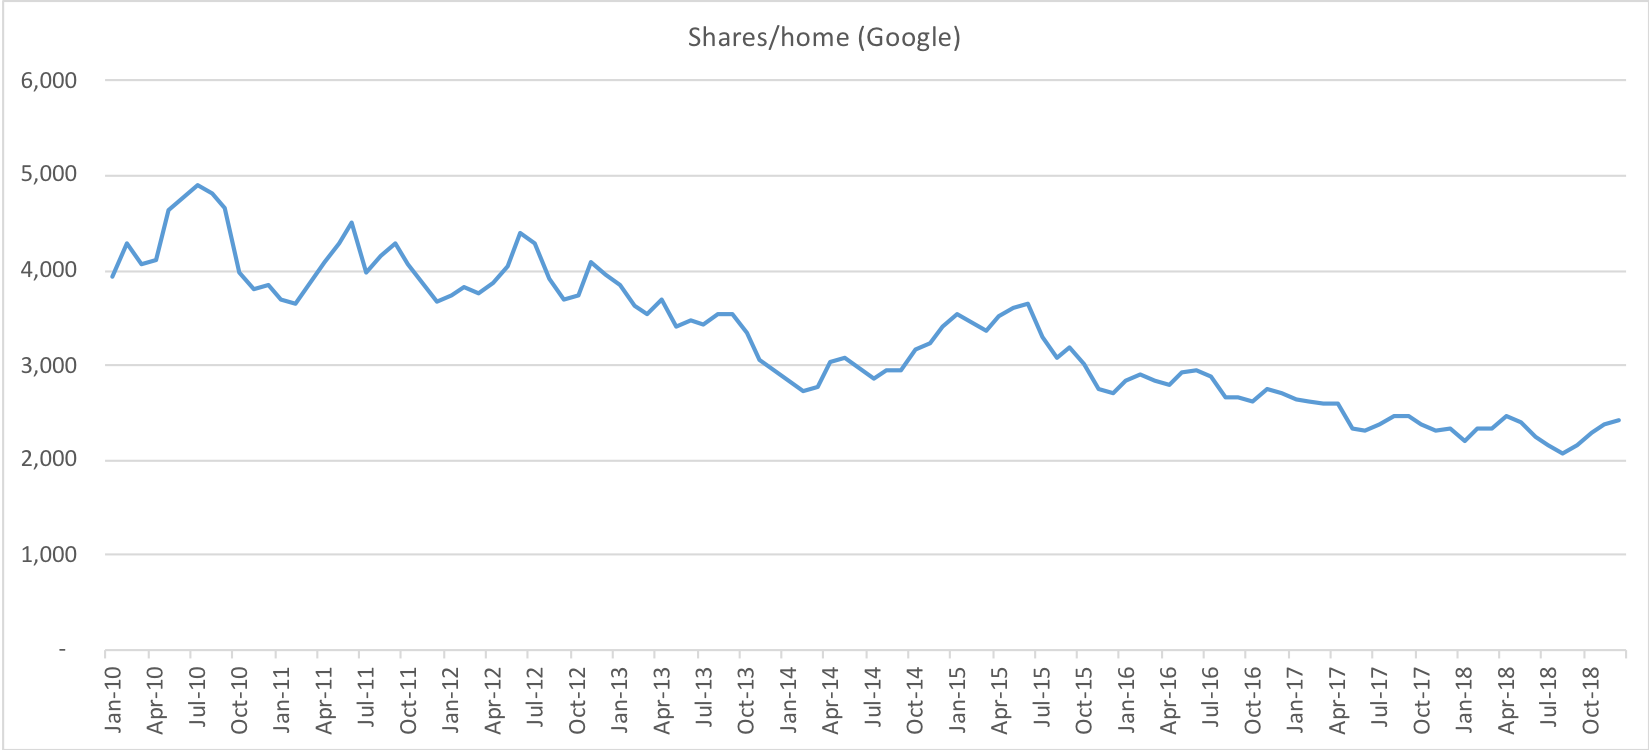
How many select tech stock shares you need to buy a house in the Bay Area?
Notes on index methodology:
- For the tech stocks index price, it is a market-weighted average of select Silicon Valley-headquartered public companies: Apple, Facebook, Google, Intel, Intuit, Nvidia, Oracle, and VMWare
- For the housing prices, this is a “median Silicon Valley home price” (weighted for the size of the regions) using Zillow ZHVI home values for the following Peninsula regions (i.e., not including San Francisco or East Bay): Atherton, Belmont, Cupertino, Foster City, Los Altos/ Hills, Menlo Park, Mountain View, Palo Alto (including Stanford), Redwood City, San Mateo, Santa Clara, Sunnyvale, and Woodside
- Note: all underlying historical stock prices have taken into account the effects of stock splits, dividends, and distributions in such a way as to avoid jumps in share price due to these events; without this, an event such as a 2:1 stock split would cause the shares per home value to double overnight
Thanks to Andrew Smith for his research help.
Charts provided herein are for informational purposes only, and should not be relied upon when making any investment decision. Past performance is not indicative of future results.