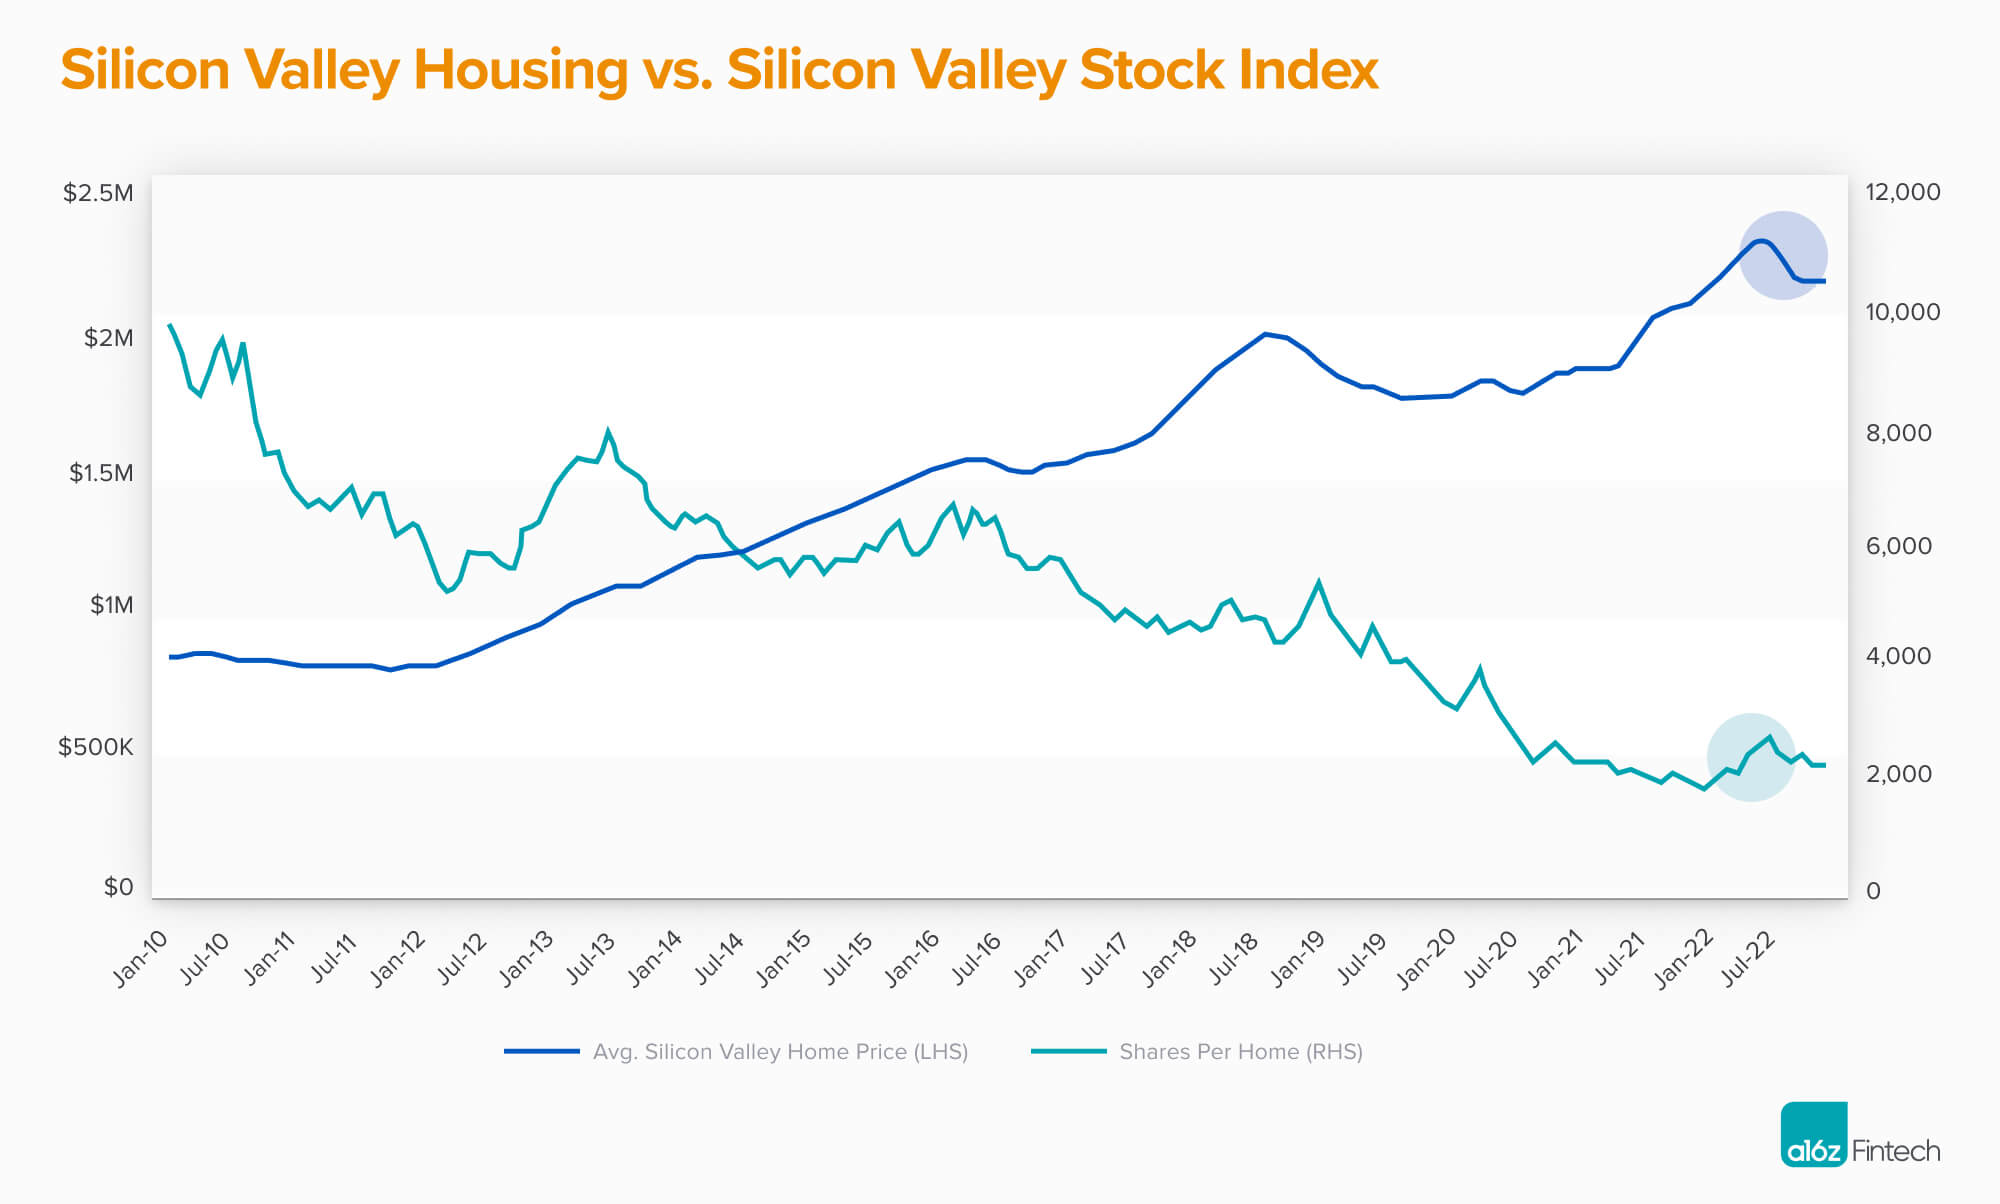
As we first shared in 2019, everything is relative — especially home prices in the Bay Area. These prices have continued to rise on an absolute basis over the last 12 years; the typical home in Palo Alto, for example, rose in value from $1.3 million in 2010 to $3.6 million in 2022. If you look at prices as a function of the “gravity-distorting” effects of technology stocks, however, it turns out that housing has actually gotten much cheaper, so long as you’ve continued to use your base currency as an index of these technology stocks.
This gravity-distorting effect was further accelerated during the Covid-induced bubble, where there was a sharp drop in the number of shares of a hypothetical technology index required to purchase a typical home in Silicon Valley as stock prices skyrocketed.
However, as interest rates rose to quell inflation following this massive boom, these technology stocks began to crash. Interestingly, there was a 6-month delay (see circles in the chart above) from when tech stocks began crashing to when home prices were impacted (Jan 2022 versus July 2022). This is because unlike the stock market, an efficient, liquid market with constant trading, the housing market is inefficient and prone to “freezes” where transactions just…stop. In theory, home prices should have fallen immediately as rates rose (given that higher monthly mortgage payments usually lead to less buyer demand). However, three phenomena delayed this. First, there was the “benefit of no trades”; many homeowners did not want to come to a loss on their home, nor could they simply sell a single share (out of a hypothetical 100) of their home as they could a stock. Secondly, there is still a structural undersupply of housing in many areas of the housing market, Silicon Valley included. And third, although less relevant for the Bay Area, new sources of demand, including institutional investors and “flippers” acting as market makers, tend to keep asset prices steady.
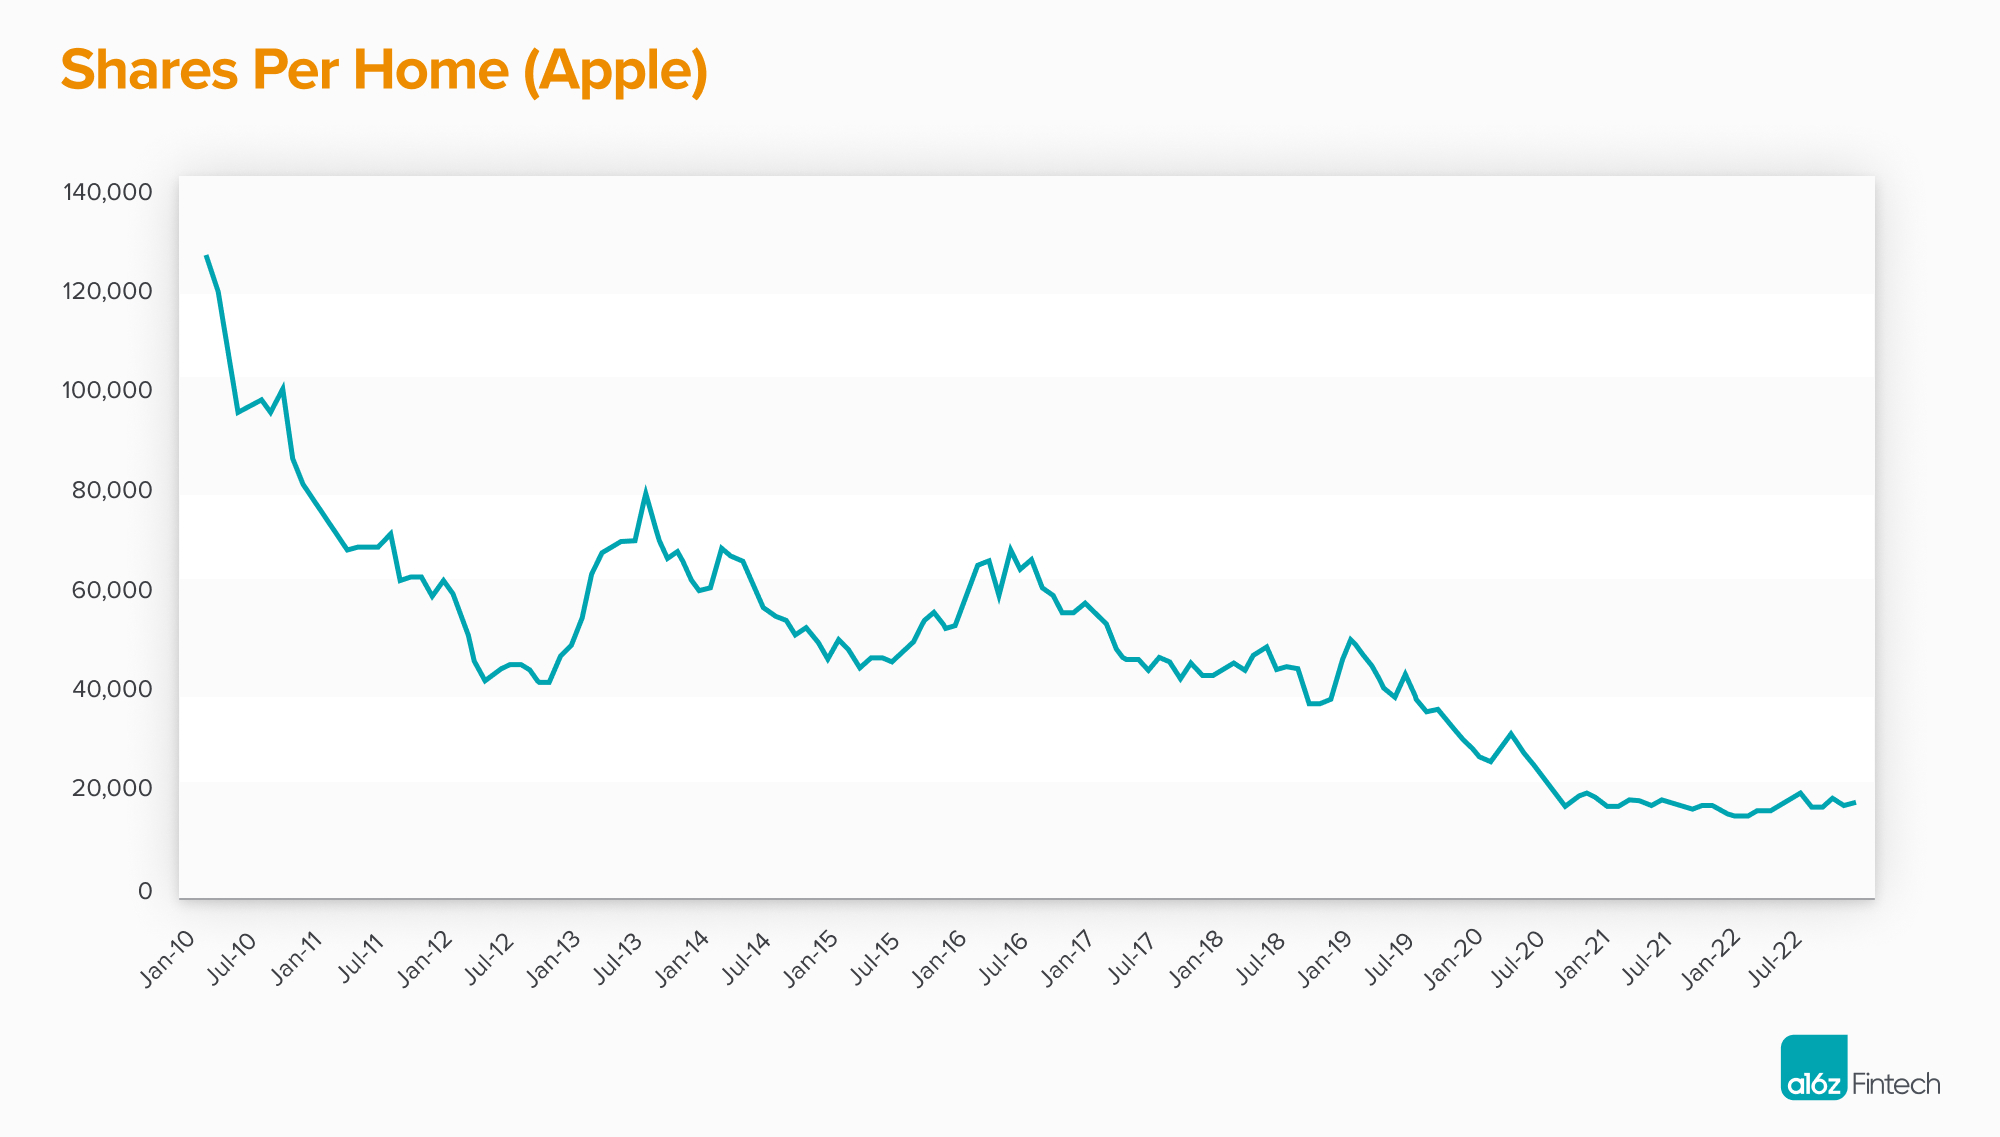
For a single stock view, here’s how many shares of hypothetical Apple stock it would take for you to buy a house in the Bay Area.
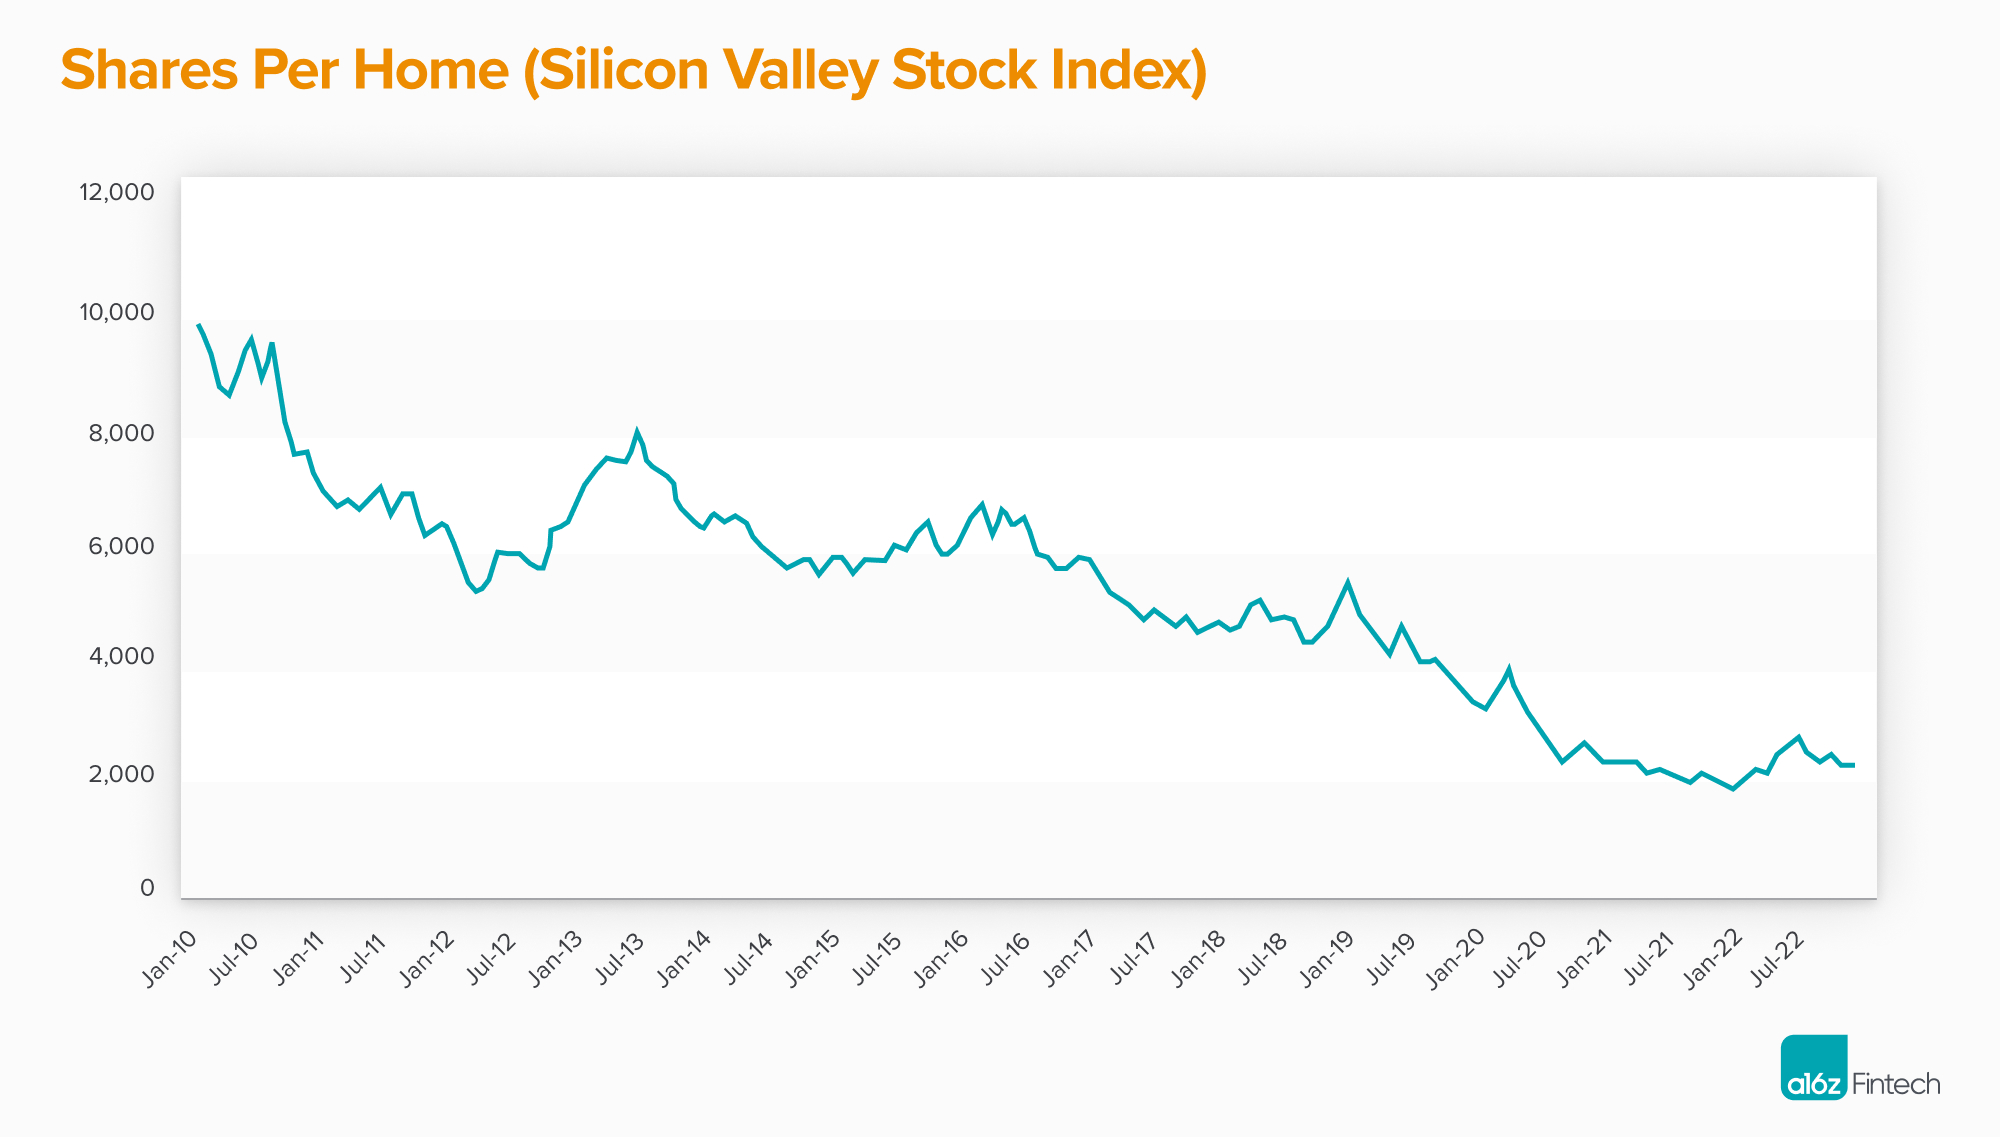
Here’s how many shares of a hypothetical Silicon Valley Stock Index it would take for you to buy a house in the Bay Area:
Notes on Index Methodology:
- For the tech stocks index price, it is a market-weighted average of select Silicon Valley-headquartered public companies: Apple, Facebook, Google, Intel, Intuit, Nvidia, Oracle, and VMWare.
- For the housing prices, this is a “typical Silicon Valley home price” (weighted for the size of the regions) using Zillow ZHVI home values for the following Peninsula regions (i.e., not including San Francisco or the East Bay): Atherton, Belmont, Cupertino, Foster City, Los Altos/Hills, Menlo Park, Mountain View, Palo Alto (including Stanford), Redwood City, San Mateo, Santa Clara, Sunnyvale, and Woodside. A previous post on this topic used a “median Silicon Valley home price.”
- Note: All underlying historical stock prices have taken into account the effects of stock splits, dividends, and distributions in such a way as to avoid jumps in share price due to these events; without this, an event such as a 2:1 stock split would cause the shares per home value to double overnight.