
Tech: More Undervalued Than One Might Assume
If there’s a bubble it’s eluding most large cap tech stocks — the likes of Apple, Facebook, Google, IBM, Microsoft, Oracle, and so on. In fact, large cap tech has traded below industrials for the last five years.
In other words: Not only is the tech sector not overvalued by any measure — absolute, relative, or historical valuation multiples — but there’s plenty of unlocked value.
This, by the way, is why we’re seeing more corporate activism and corporate splits/spinoffs lately. Activists typically do not chase expensive companies (see for example Elliott/EMC and Icahn/Apple). And spin-offs are typically pursued as a means to unlock unappreciated value.
Here are a few charts that help illustrate this view…
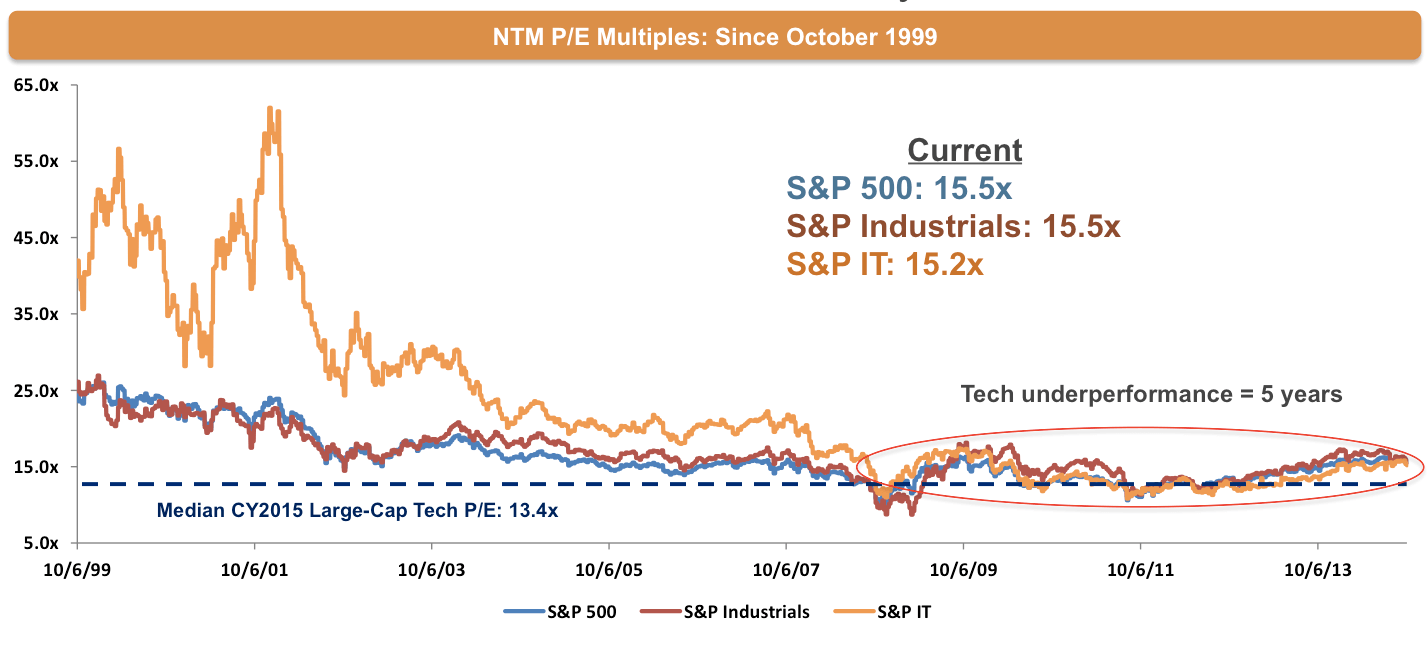
As you can see from the chart below, forward P/E multiples for the S&P IT Index have trailed the S&P Industrials Index (a broad baseline segment) for the last five years. This is different from the environment at the beginning of the last decade, where the S&P IT Index traded at a significant premium to both the S&P Industrials and the S&P 500 over several years.
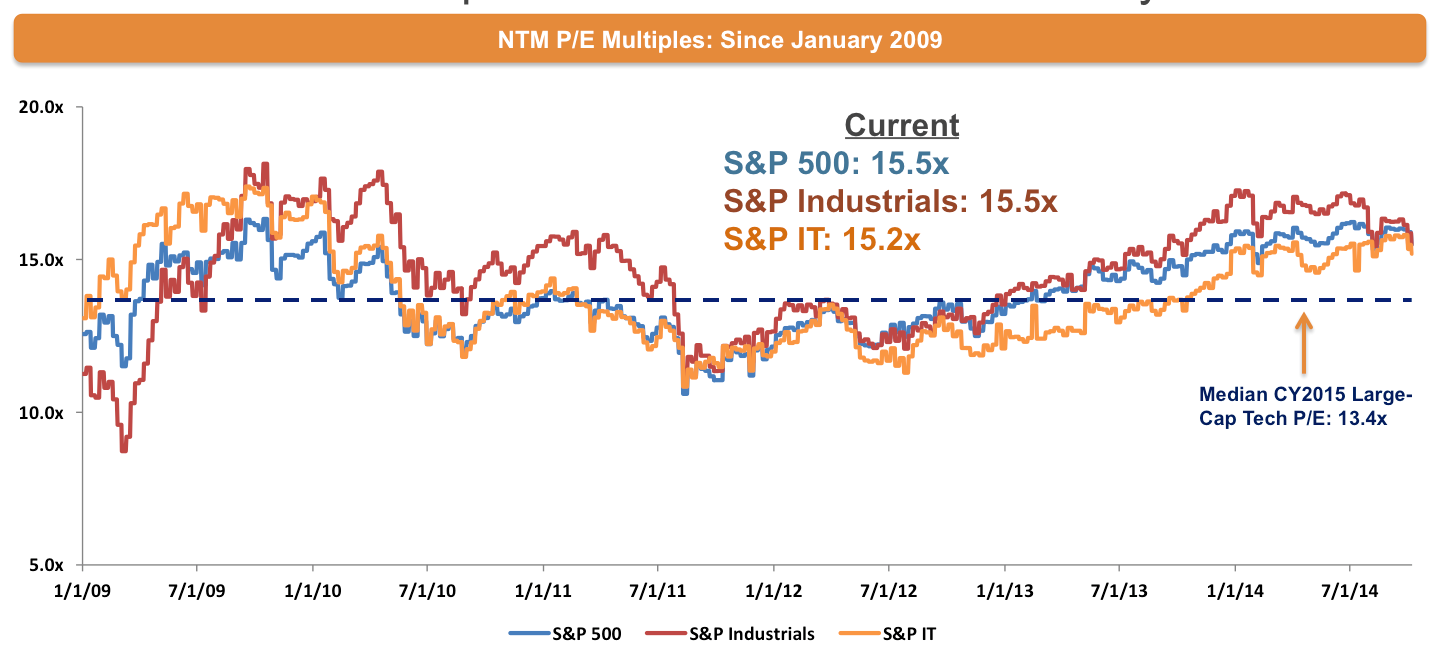
Zooming in on the last five years: Not only has the S&P IT Index trailed the S&P Industrials Index, it has also trailed the S&P 500 Index overall for most of that time. So by both measures, tech has underperformed the broad market in general:
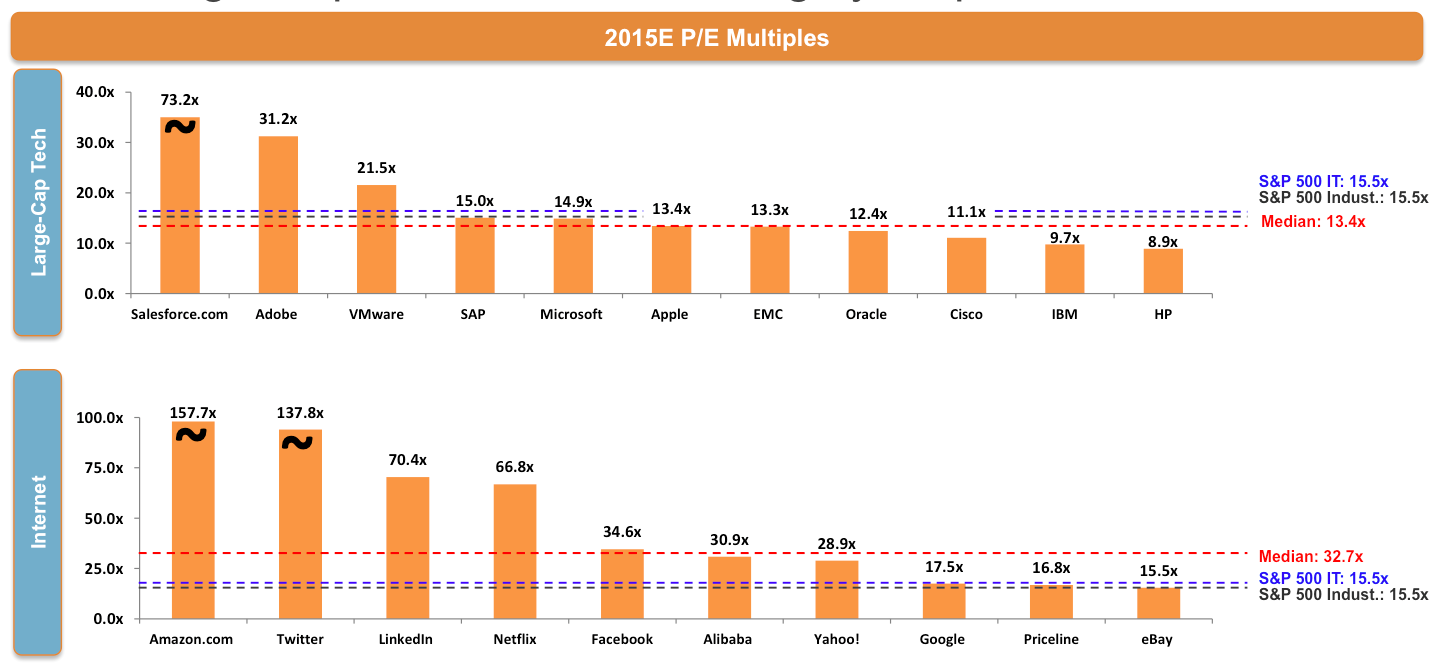
Now let’s analyze individual companies — particularly large-cap tech and internet, which we care about because these are two bellwether tech categories.
On an individual company basis, one can point to any particular metric of valuation or profitability and either extrapolate that to tech as a category, or tie it to the specific dynamics of a company’s strategy or stage (see for example our analysis of Amazon’s profit model).
We prefer to look at categories of companies to infer valuation for a group as a whole, rather than relying on individual company dynamics, to inform our views on an entire category:
Lastly, one important thing we pay particular attention to is growth, because in growth companies — and technology in particular — investors are often willing to pay a higher relative multiple to gain exposure (and investment returns) for the Next Big Thing.
The most common way to account for growth in this analysis is to normalize P/E valuations through PEG ratios. This ratio divides a company’s P/E ratio by its annual EPS growth, and can normalize a high-P/E multiple stock with a high growth rate, to a lower P/E multiple stock that is not growing as quickly. In other words, it allows you to more directly compare two companies that are growing at different rates.

As you can see from the chart above, the S&P IT Index is trading at an even more significant discount than the S&P Industrials Index, as technology companies are broadly faster-growing than industrials. The large-cap tech group that we follow is trading at a very slight premium in this analysis, due to their higher maturity and lower growth — and despite their lower P/Es (as demonstrated in our second chart).
In summary: While it is easy to point to a single company and declare it overvalued, either on an absolute or relative basis, it doesn’t make sense to categorize the technology sector as a whole overvalued given the above view.
data here sourced from: S&P Capital IQ
-


Jamie McGurk is the General Partner at BAM Elevate