Click here for 2021 edition of the Marketplace 100.
Today we introduce the Marketplace 100, a ranking of the largest and fastest-growing consumer-facing marketplace startups and private companies.
Over the past few decades, marketplaces like eBay, Airbnb, Uber and Lyft, Alibaba, and Instacart, have become some of the most impactful companies in the world economy. Collectively, millions of individuals and small businesses make a living operating on these platforms, where hundreds of billions of dollars of goods and services trade hands each year. Today, ridesharing platforms alone account for roughly 1 percent of US household income and there are an estimated 75 million gig workers in the US, and growing, according to the Fed. By possessing powerful network effects, marketplaces can become huge economies themselves. Over time, such companies have revolutionized a series of diverse industries, from travel to food to childcare. Marketplaces are at the center of many of society’s most important trends—the gig economy, the new generation of creative work, microentrepreneurship, and beyond. There’s much more to come. As investors in Airbnb, Instacart, and many others , it’s no secret that we’re bullish on (if not obsessed with) marketplace companies.
Most are familiar with the most successful and established companies in the industry, but for the Marketplace 100, we focus on startups and private companies. After all, our focus is the future: What’s next? What are the new, rising marketplace startups that will define the industry landscape in the coming years? What industries are likely to be revolutionized by connecting people through marketplace platforms? Which categories are the most competitive, with multiple players, and which are already dominated by a lone giant?
To answer these questions, we turned to the data—in this case, anonymized, aggregated US consumer spending data captured via credit cards, debit cards, and bank transfers, which has become a popular tool for analyzing high-growth startups. For the Marketplace 100, we use data from a company called Second Measure, a firm that analyzes billions of purchases to track real-time consumer behavior and relative sales across 4,500 merchants. (See the methodology below for more details.) We collected this anonymized data from millions of consumers and analyzed their spending. This data lets us see which marketplaces are capturing the most dollars, what’s trending up and down, and which categories are growing fastest. The companies on this list were then ranked using a common industry metric, Gross Merchandise Value (GMV), which is extrapolated from how many total dollars consumers are spending against each company. This provides an approximate measure of a marketplace’s scale and its importance in the economy, based on how much revenue is trading hands between buyers and sellers.
Of course, there are many caveats and limitations to this approach: Notably, it leaves out most B2B marketplaces (though there are many we’re excited about), and understates companies that might receive payments mostly via cash, check, or EBT. Some products are hybrids of marketplaces and other business models; in those cases, we’ve used our best judgement. Second Measure’s transaction data is limited to the United States, which excludes many high-growth startups that do business internationally.
 Here are our key takeaways from the Marketplace 100, which we’ll unpack in more detail:
- We were surprised by a number of startups that made the list, including many relatively unfamiliar names
- A small number of marketplace startups—four of them—account for 76 percent of consumer spend
- Travel, food, and groceries are the largest categories, by a lot
- Several emerging categories are intriguing, including local indie brands, celebrity shout-outs, streetwear, fitness memberships, and even car washes
- The fastest growing marketplaces are growing really fast—3x to 5x year-over-year
The a16z Marketplace 100: 2020
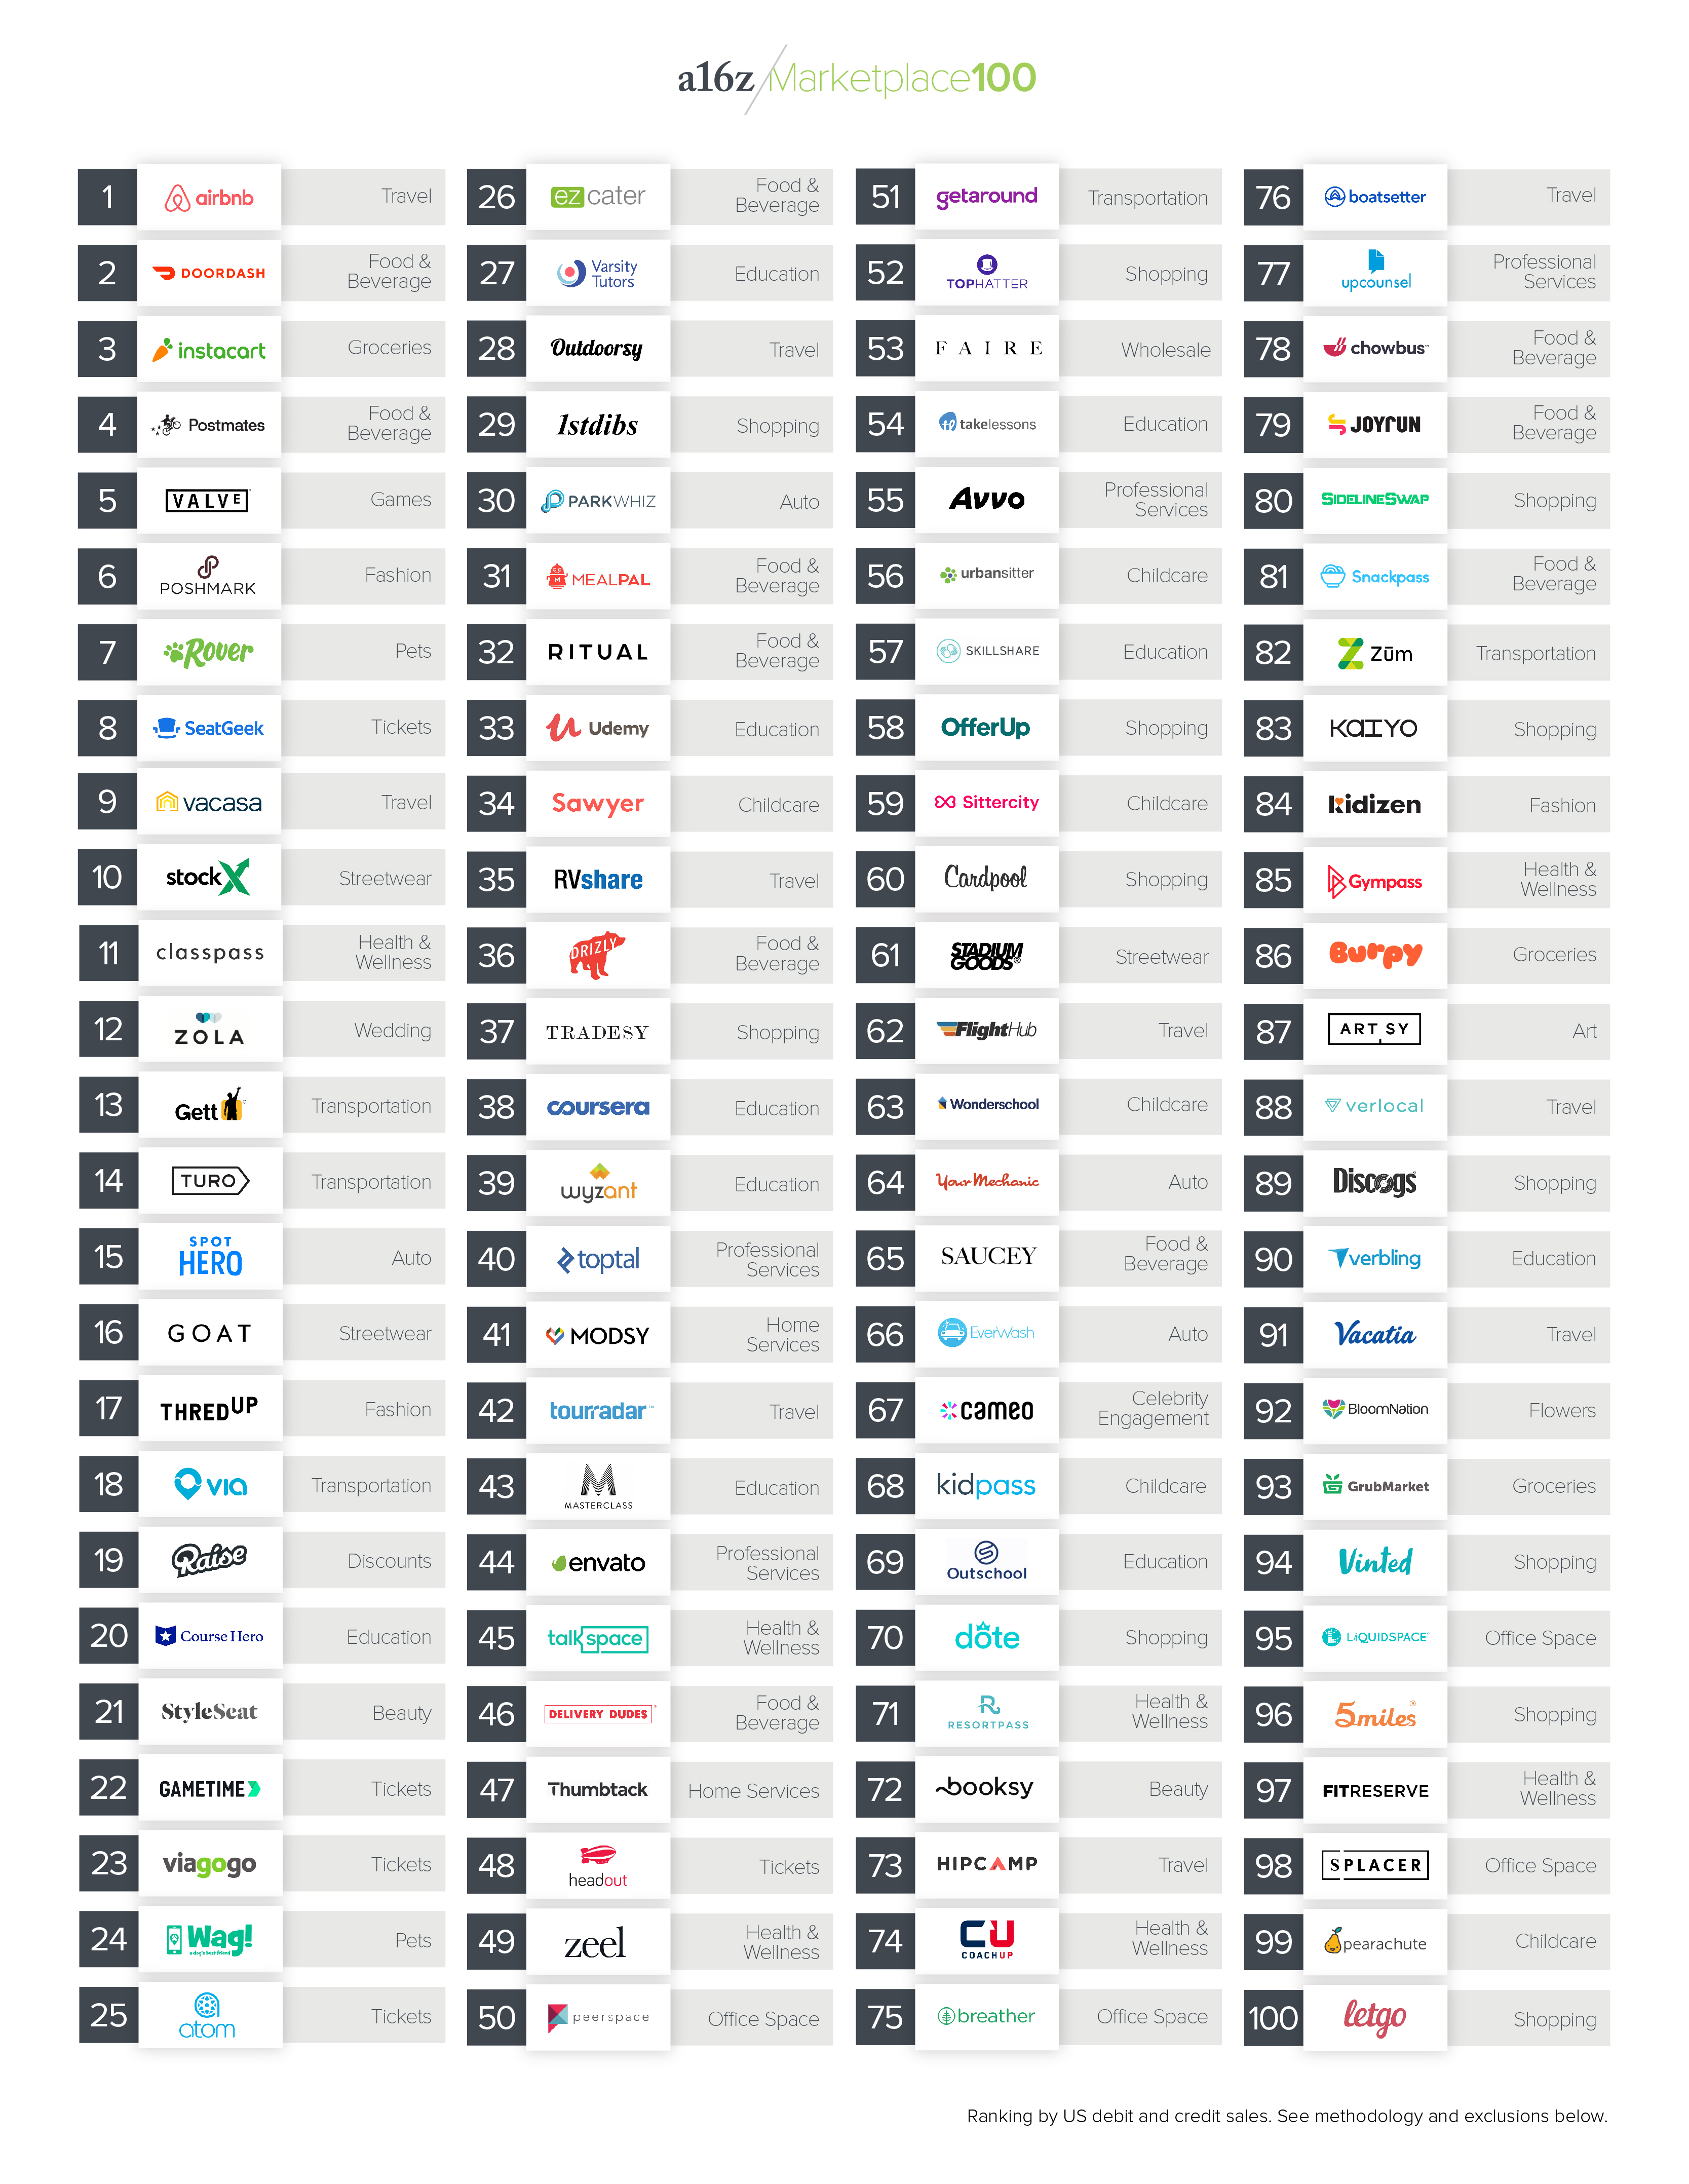 View an itemized list of the companies in the Marketplace 100: 2020 here.
Key Takeaways From the Marketplace 100: 2020
1. A handful of companies dominate.
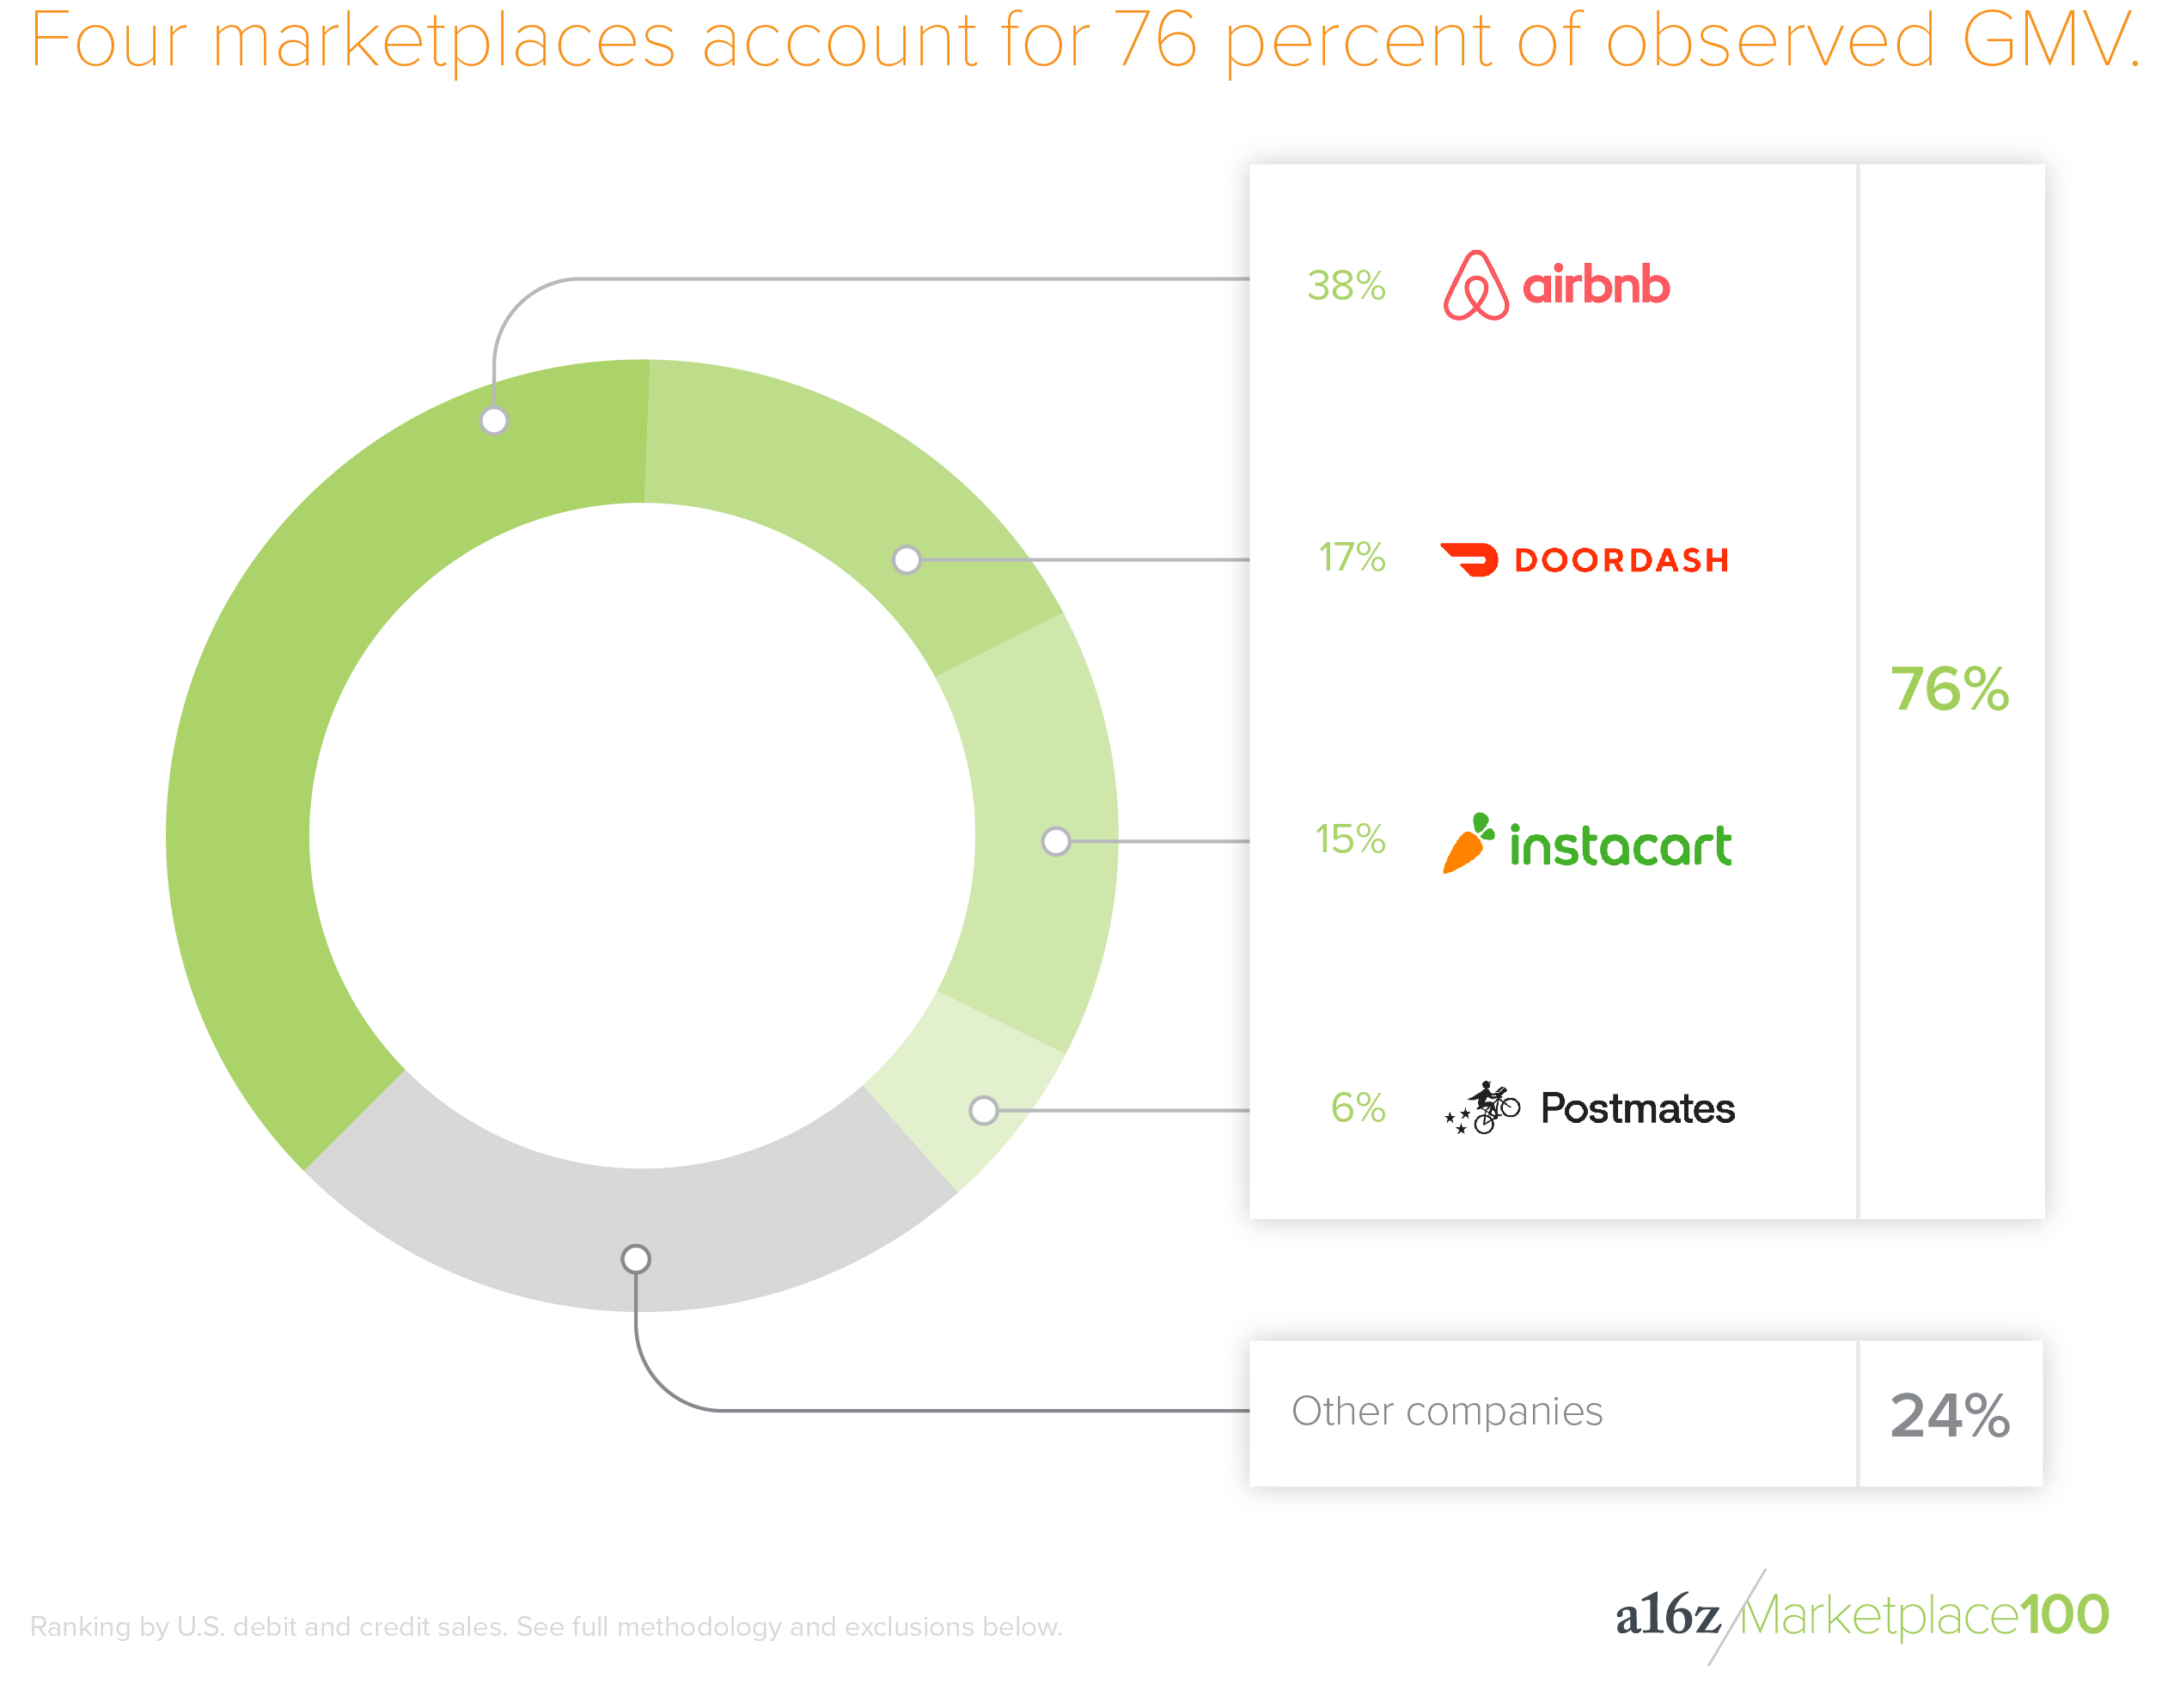 The biggest marketplace companies are big—
really
big. The top 4 companies (Airbnb, Doordash, Instacart, and Postmates) account for 76 percent of the list’s total observed GMV, even though there are 96 other marketplace companies on the list. Interestingly, three of the four are ways to get food delivered to your home. Similarly, almost all the companies on the list harness technology to interact with the offline world—using mobile apps to make food, healthcare, childcare, and fitness more convenient and accessible.
The list-topping marketplaces have been around for quite a few years. The top 4 companies on this ranking were started between 2008 and 2013, making them 7 to 12 years old as private companies, with billions in revenue and thousands of employees. Contrast that to the late-‘90s, when the average time to IPO was around 3 years, with tens of millions of revenue—big difference! There’s also an obvious distinction between the top 4 and the dozens of true startups on the list—those founded within the last three years—which are likely to climb the chart with time.
The biggest marketplace companies are big—really big. The top 4 companies account for 76 percent of the list’s total observed GMV, even though there are 96 other marketplace companies on the list. Click To TweetIt’s notable that while nearly every company on the Marketplace 100 should have strong network effects, only a handful of them have achieved huge scale. But once they hit critical mass, they get big, showing a power law distribution in the extreme. It’s not the 80/20 rule, it’s the 80/4 rule. It reinforces the idea that network effects, though powerful, are more apt to accelerate what’s working, rather than propel a small, up-and-coming company to dominance.
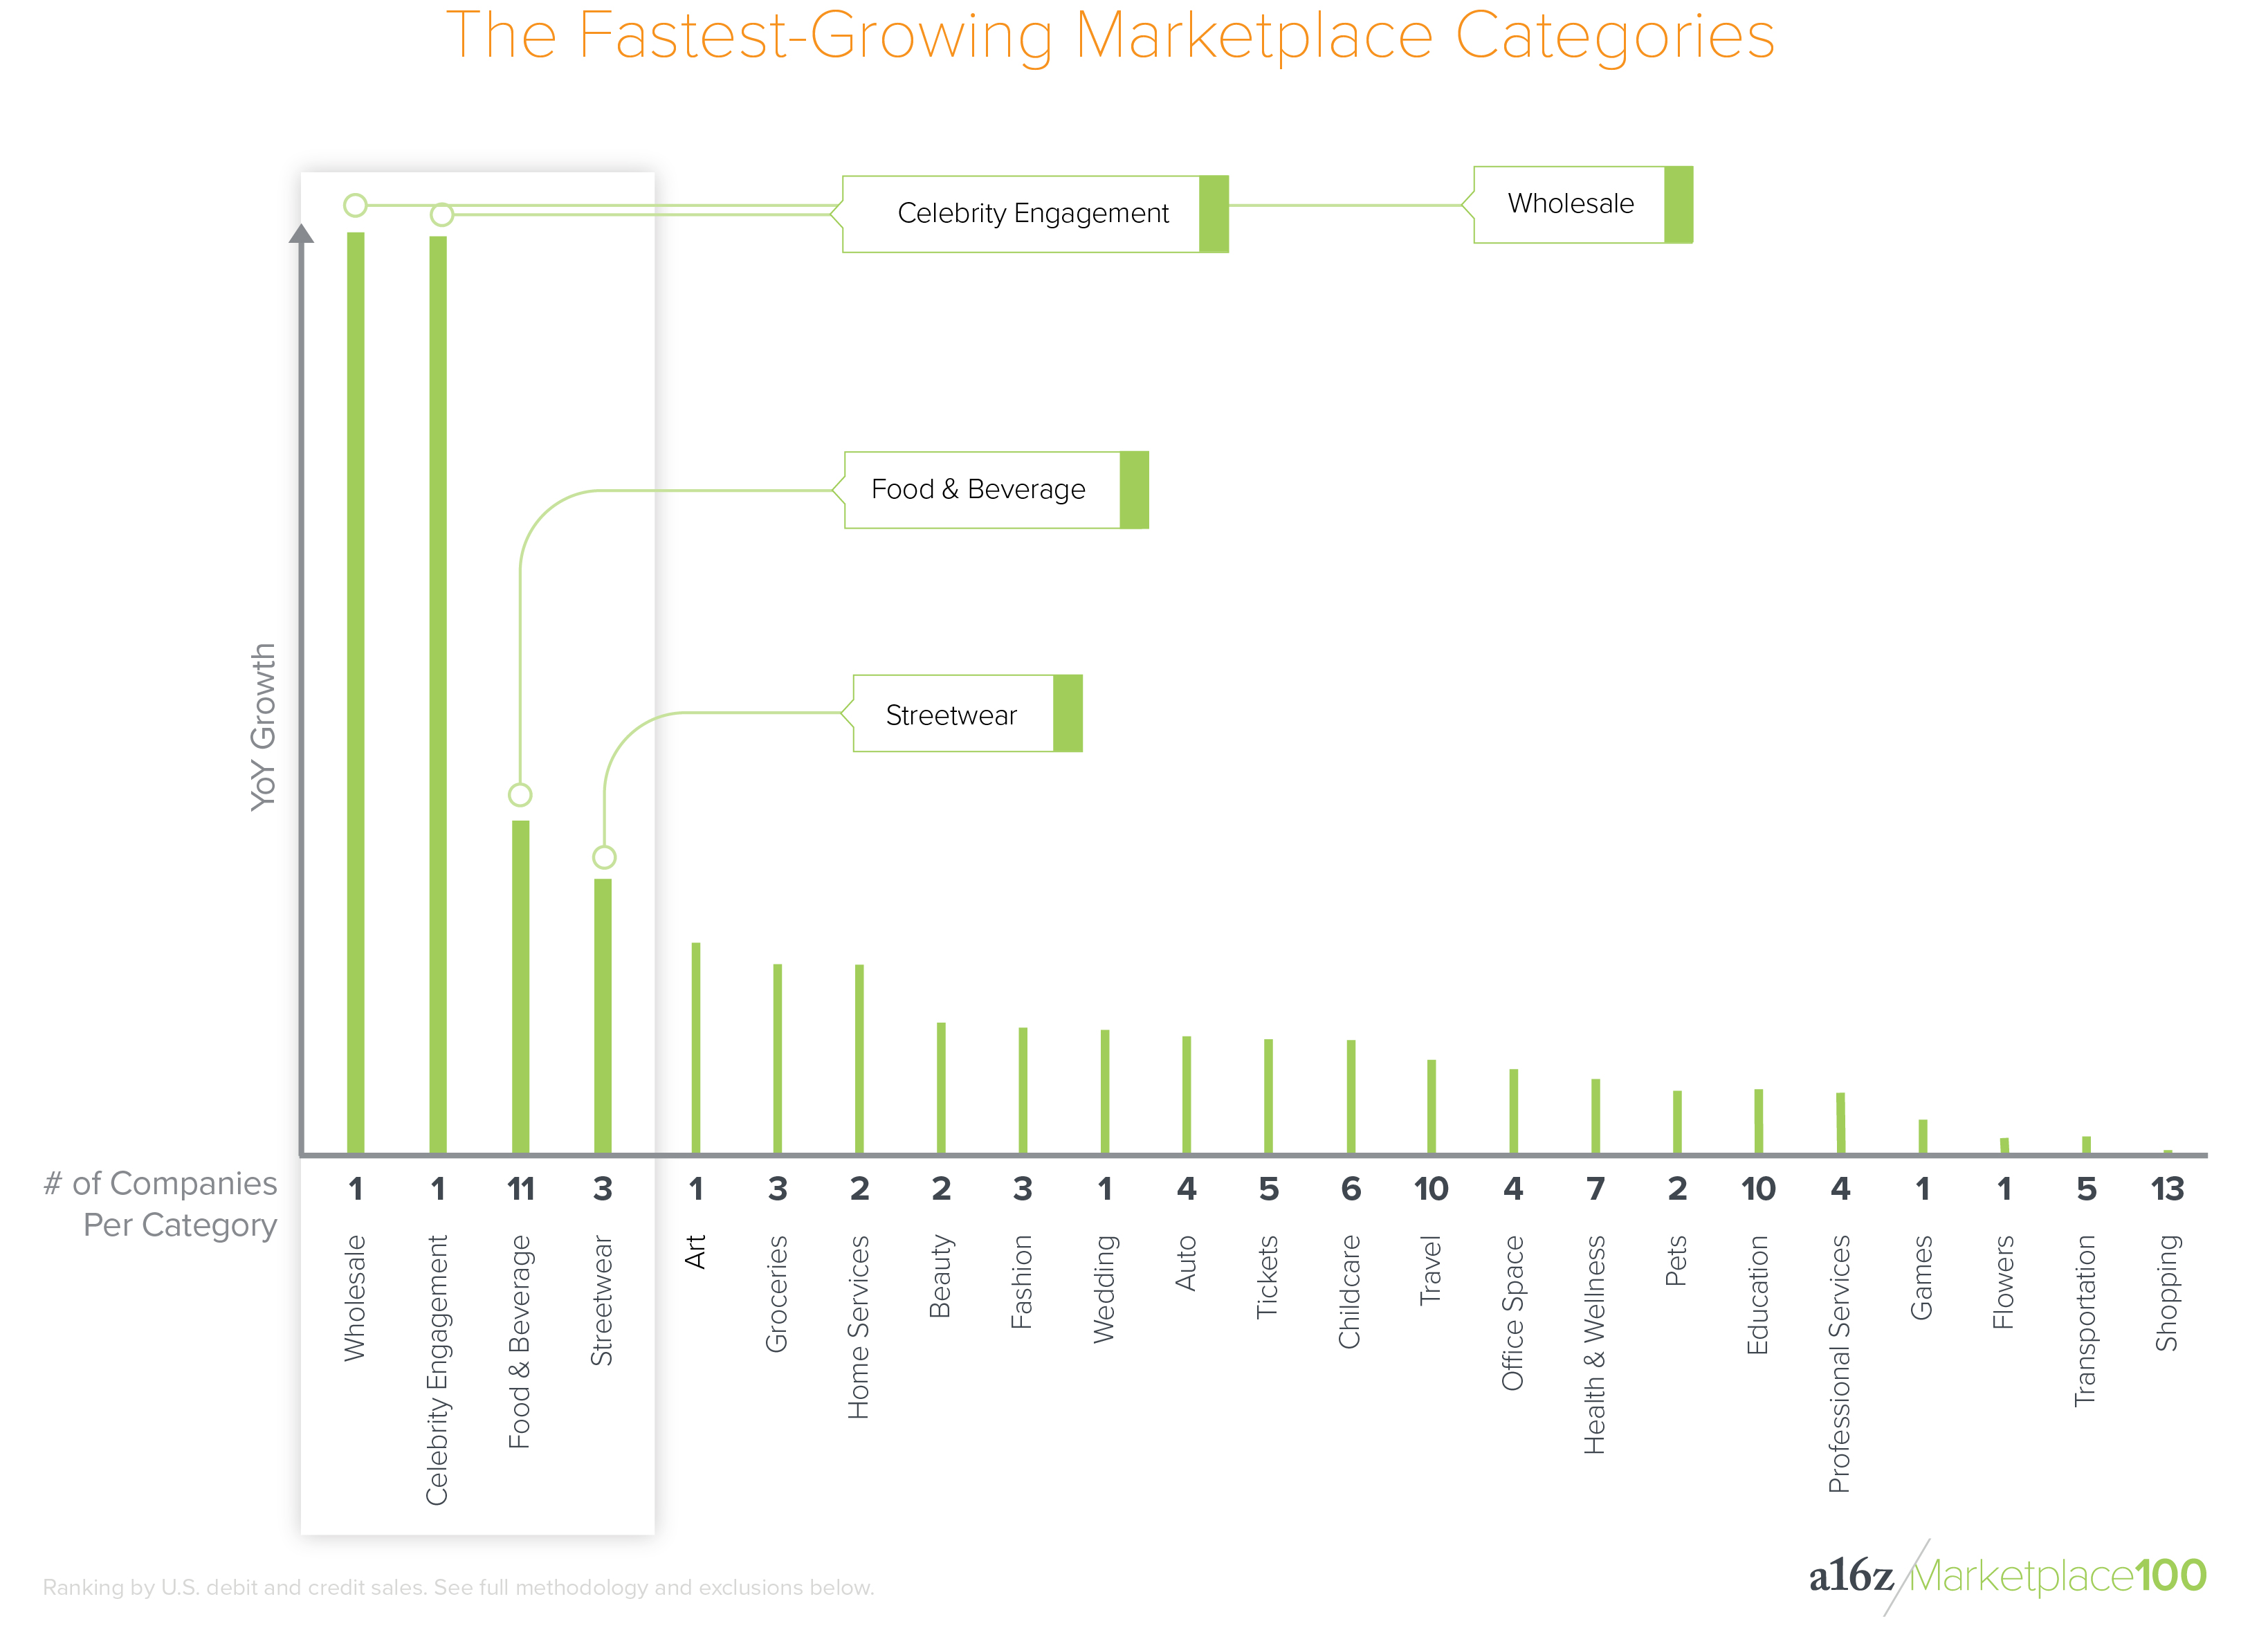
2. The fastest growing categories exemplify why marketplaces can be so powerful for consumers and suppliers: they create new channels in markets with pent-up demand, unlocking new transaction behaviors.
 Faire
(#53) is a wholesale marketplace that allows boutique retailers to find and purchase unique merchandise from
local indie brands
. By aggregating this network of artisan brands, the marketplace empowers small retailers to source fair trade, often handmade inventory for their stores and gives creators access to a new and lucrative distribution channel.
In the cases of celebrity engagement and streetwear, there has always been a willingness for fans to purchase intimate experiences with celebrities and influencers, or for sneakerheads to trade their collectible footwear, but the means to do so were limited, offline, or untrusted. By offering celebrities an easy way to make money and build rapport with their fans, Cameo (#67) unlocked a tidal wave of demand among consumers yearning to purchase celebrity shout-outs for friends, family, even themselves.
Large-scale and fast-growing startups like GOAT (#16), StockX (#10), and Stadium Goods (#60) provide consumers with new and authenticated channels for buying and selling collectible streetwear , namely sneakers. Incumbent channels such as eBay and Craigslist were successful aggregators of supply and demand for streetwear, but struggled to build trust among consumers. In response to this slew of startup success in the streetwear space, eBay recently waived all seller fees for sneakers priced over $100, in an attempt to incentivize sales on its platform.
While celebrity engagement and streetwear are emergent marketplace categories, food & beverage continues to grow rapidly, despite its already massive scale. DoorDash (#2) continues to take market share from the likes of Grubhub, UberEats, and Postmates (#4) in the massive $22 billion food delivery market . (As public companies, the latter aren’t included in the Marketplace 100.) In the adjacent order-ahead takeout space, emergent platforms like Ritua l (#32) and Snackpass (#81) are acquiring large swaths of urban professionals and college students with clever social features like food-gifting and group ordering.
3. The fastest-growing startups reveal emergent consumer categories.
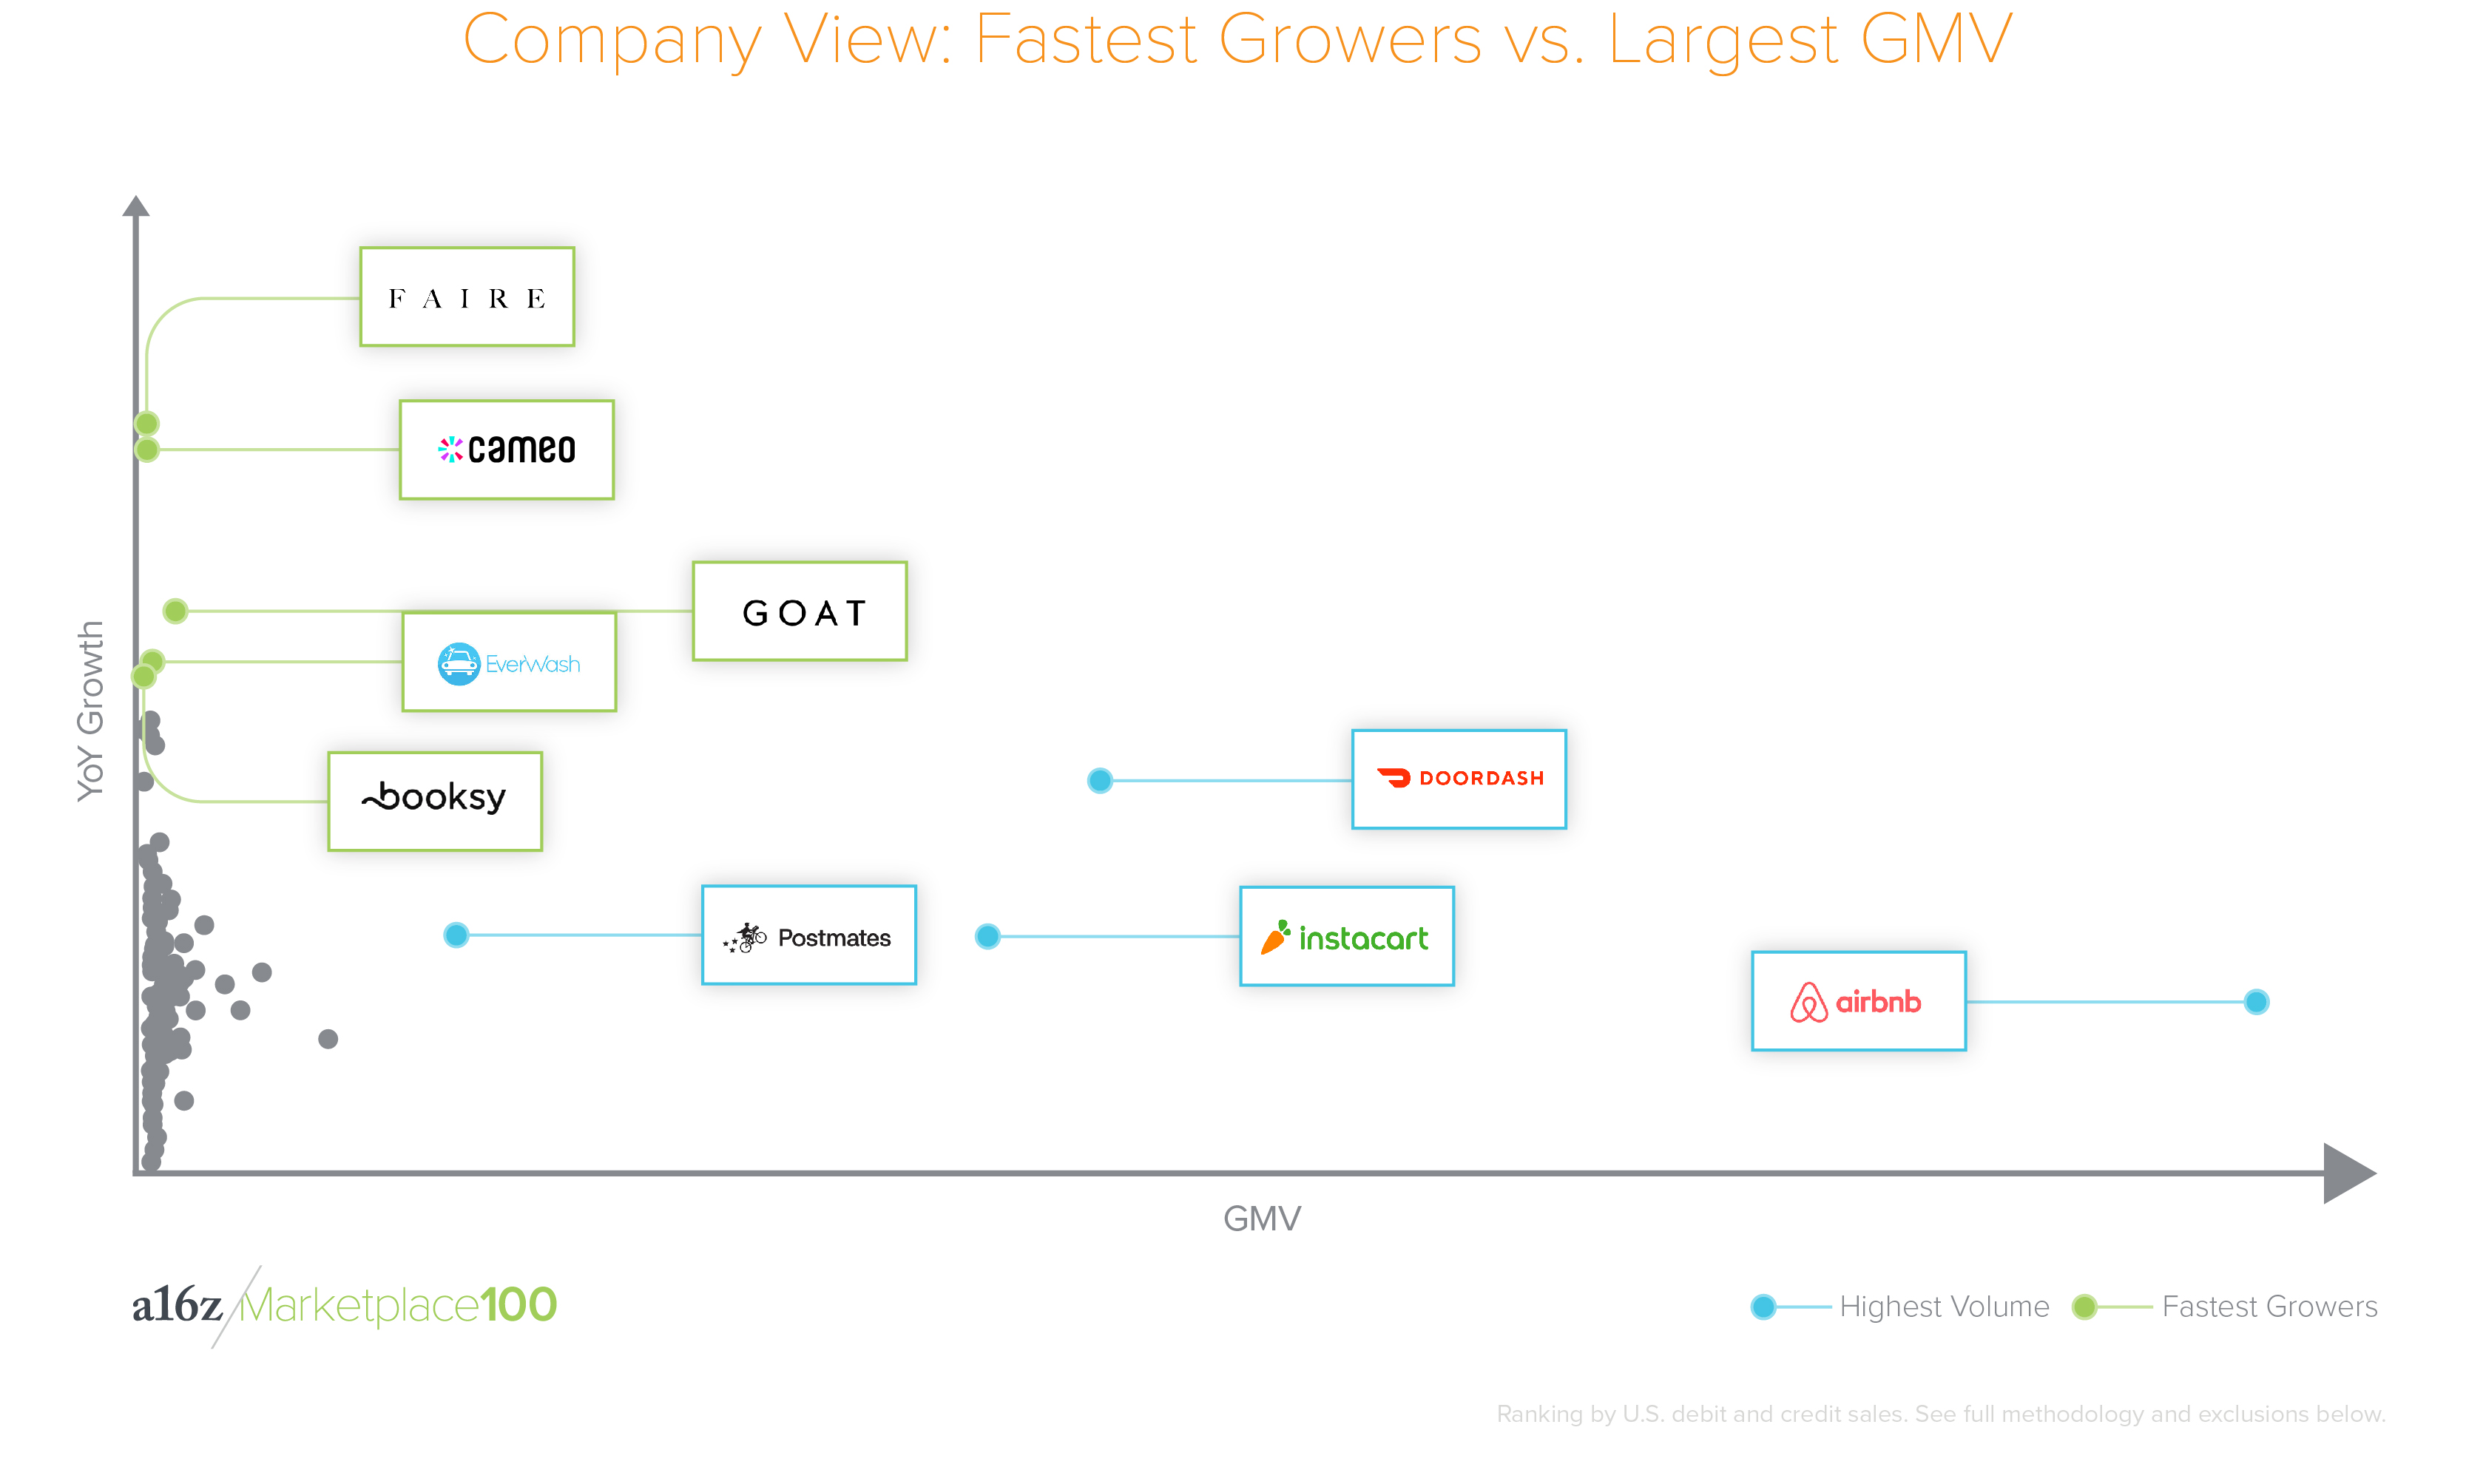
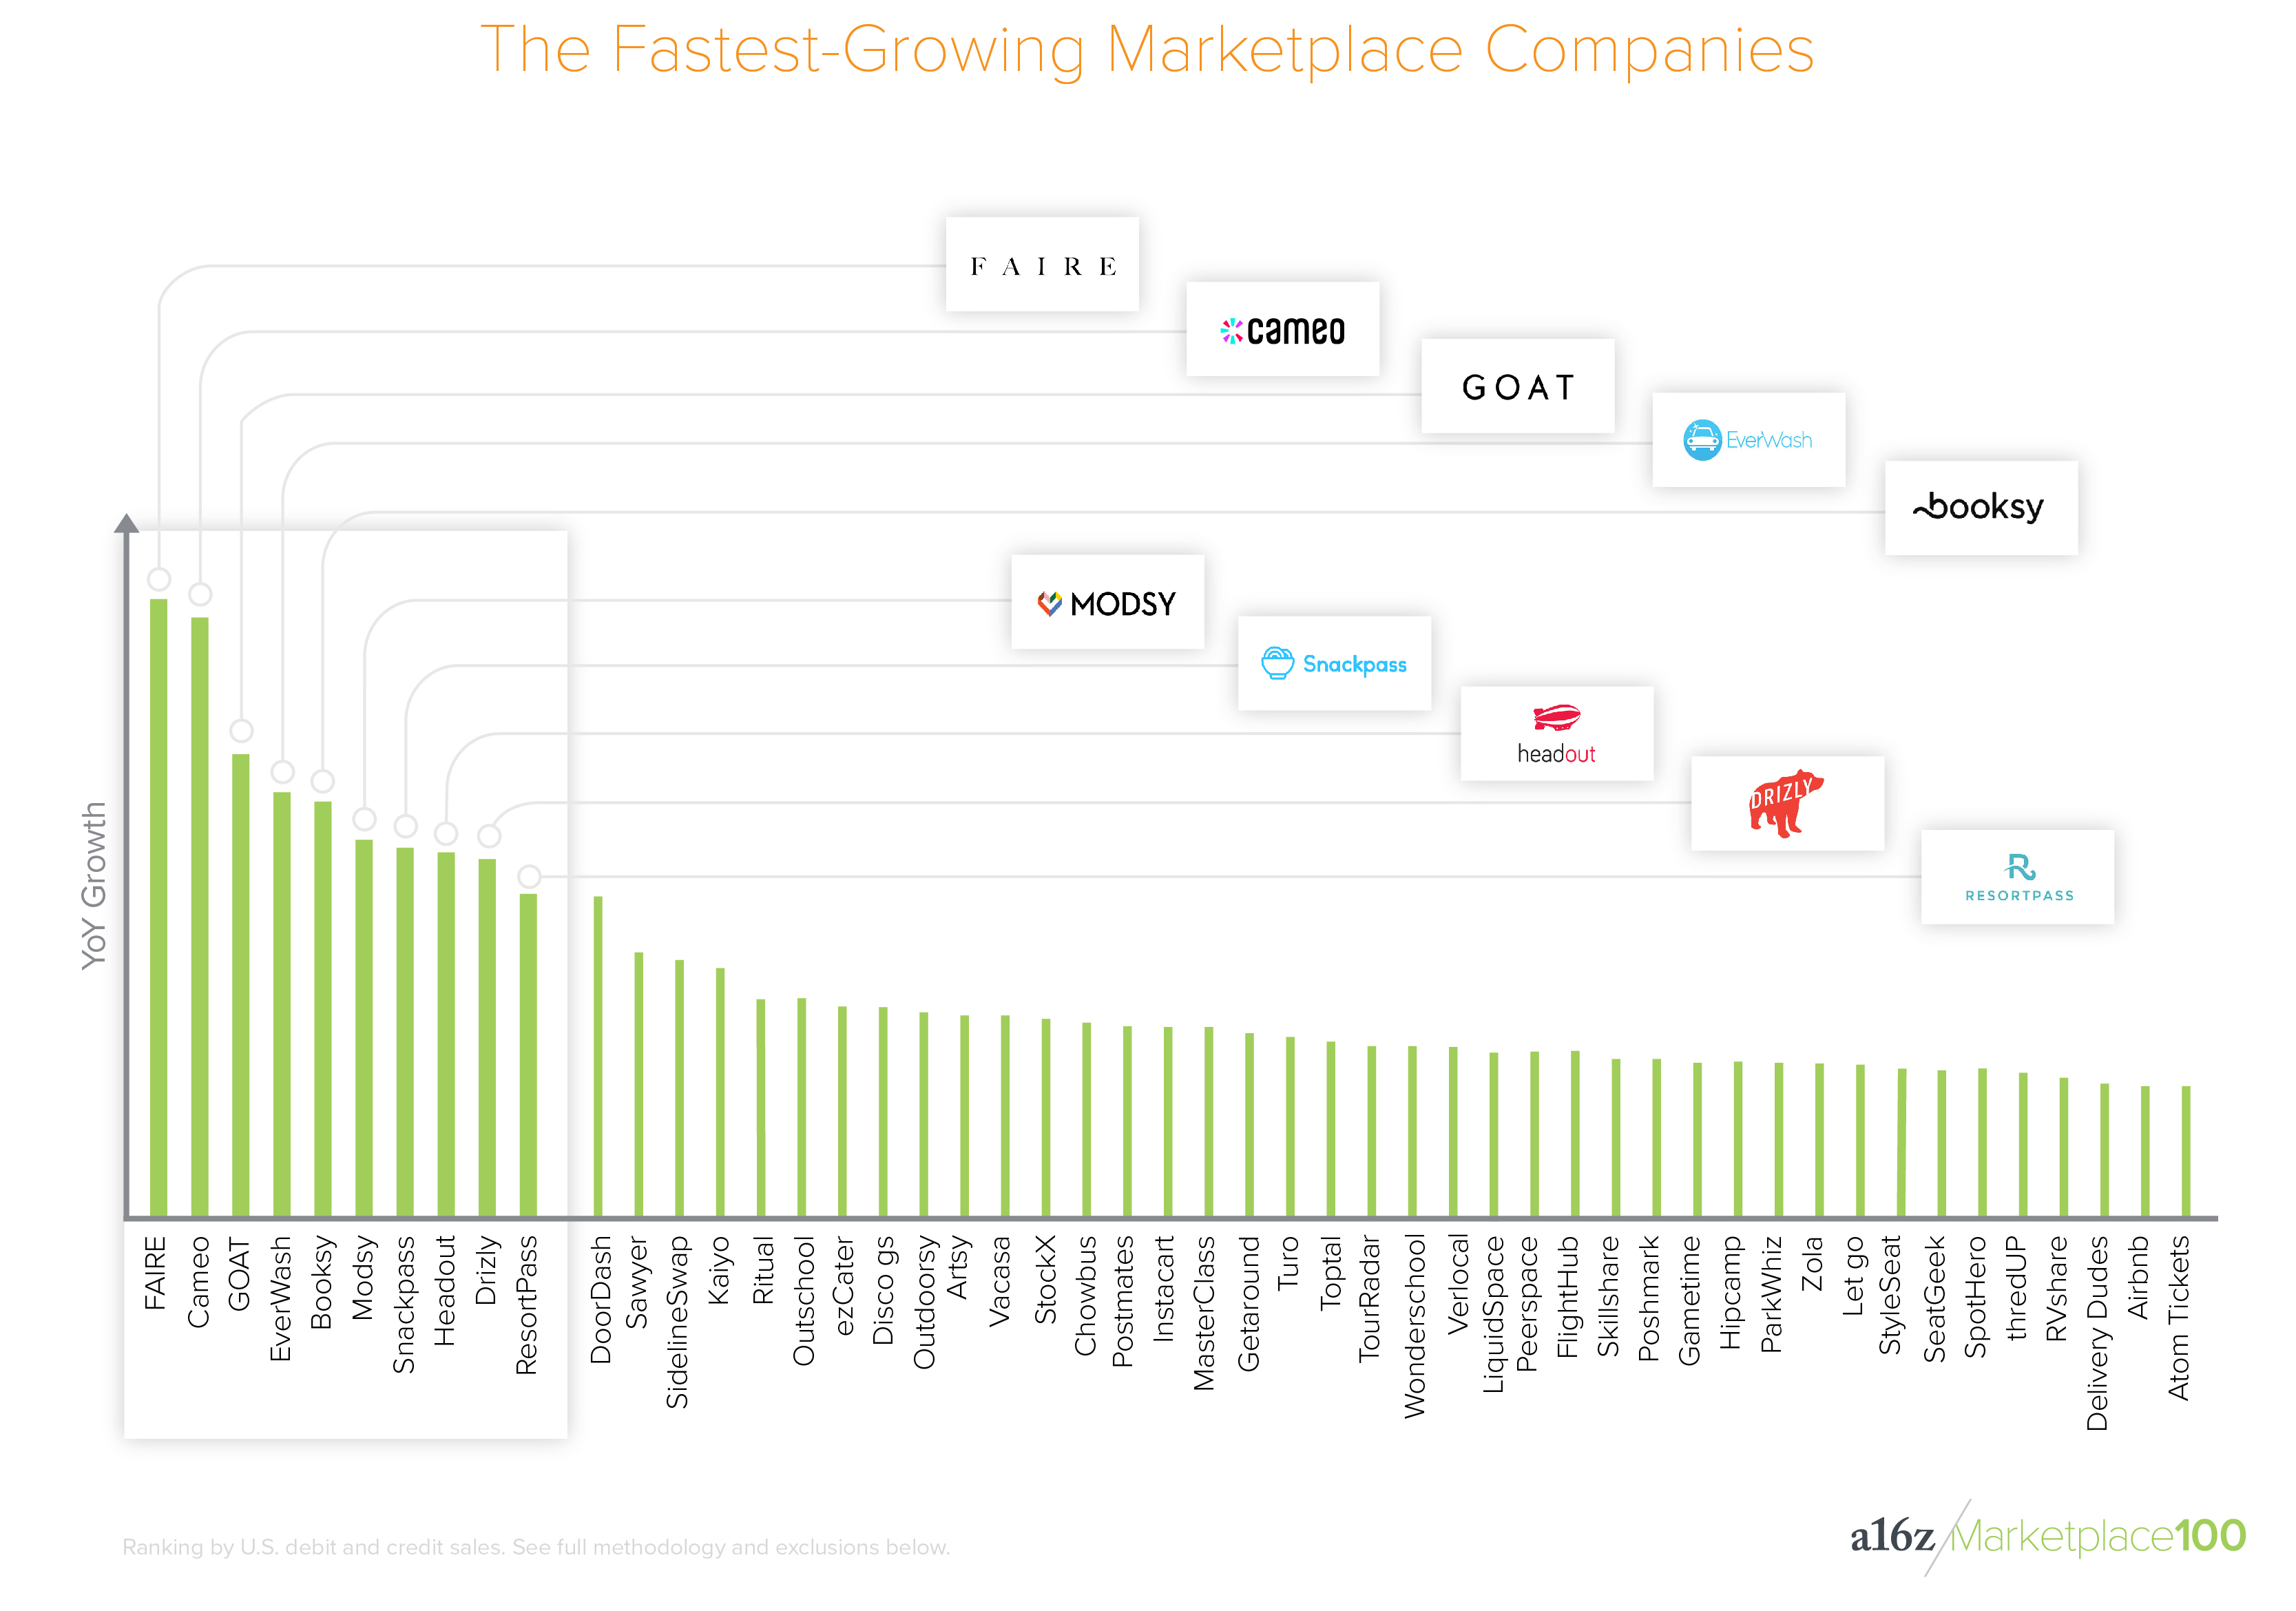 The typical lifecycle of a marketplace is that startups grow quickly in the early years—often >3-5x year-over-year. In later years, their growth rate usually slows into a more comfortable range. We see this borne out in the data, where the top 10 fastest-growing companies are growing at a top rate of 5x year-over-year. These up-and-coming companies offer the best indication of future marketplace categories.
Interestingly, these companies are emblematic of emerging categories among millennial and Gen Z consumers, including local and indie brands , celebrity engagement, and streetwear.
The top 10 fastest-growing companies are growing at a top rate of 5x year-over-year. These companies are emblematic of emerging categories among millennial and Gen Z consumers: indie brands, celebrity engagement, & streetwear. Click To TweetThe four fastest-growing companies (by year-over-year relative growth):
- Faire (#53) is a wholesale marketplace for boutique retailers to find and purchase unique merchandise from local indie brands.
- Cameo (#67) is a video-sharing marketplace where fans can book personalized shoutouts from their favorite celebrities.
- GOAT (#16) is a peer-to-peer marketplace for buying and selling authenticated streetwear and sneakers.
- EverWash (#66), the most surprising company of the top five fastest-growers, offers car owners access to a members-only network of car washes. Similar to the Masterclass model, EverWash customers have access to unlimited car washes for a flat monthly membership fee.
4. Some categories are competitive and fragmented, while others have a clear winner.
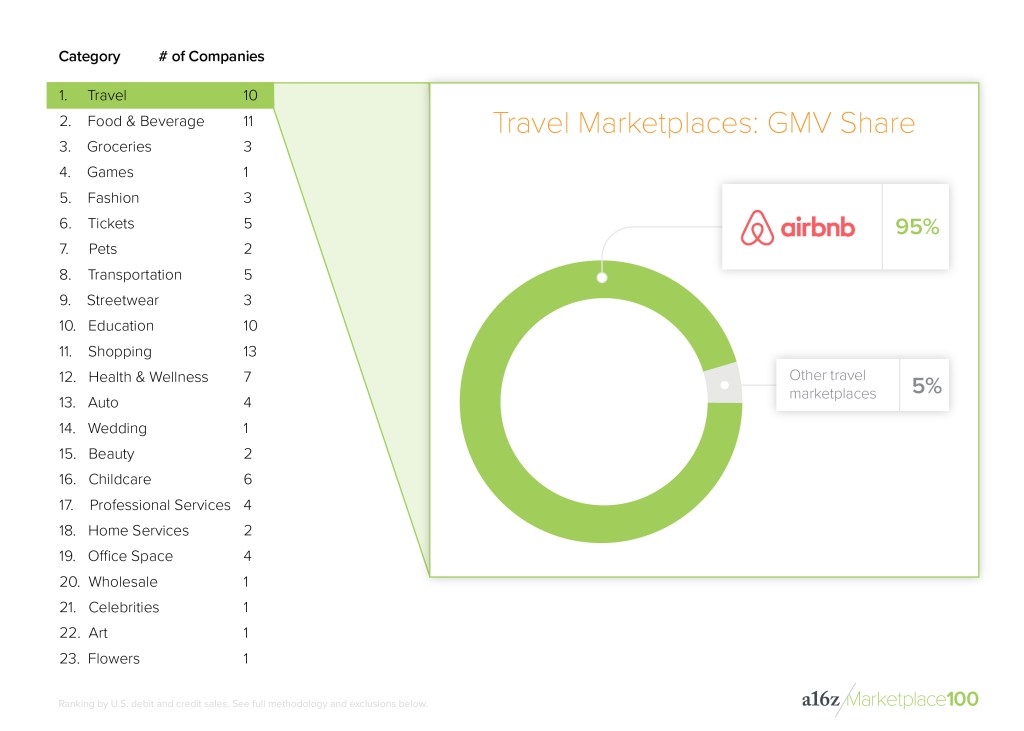
When grouping startups into their respective categories—tickets, transportation, education, and so on—we see a highly concentrated sector, as well. Twenty-one of the Marketplace 100 belong to either the travel industry or the food & beverage industry, which together account for 63 percent of the list’s total GMV. A closer look at the GMV breakdown within those categories reveals two completely different market dynamics. Within the travel segment, Airbnb (#1) is the runaway leader, accounting for 95 percent of segment GMV—of course, these days, Airbnb’s primary competitive set includes large, public companies focused on travel, as opposed to other startups.
On the other hand, the food & beverage category is much more fragmented, with multiple startups vying for leadership: Doordash (#2) and Postmates (#4) have all gained material GMV share, accounting for 72 percent and 23 percent of their segment’s GMV, respectively. Similar to Airbnb, Postmates and Doordash’s largest competitors are public incumbents, like Grubhub and UberEats.
In comparing the two categories, our theory is simple: There’s a big difference between network effects that span global and continental regions, as opposed to city-by-city networks. Airbnb’s global network effect spans regions, since potential guests book lodging outside their home base and hosts expect to receive visitors from all over the world. It is a single, global network, which provides a strong defensible moat that, thus far, competitors have struggled to copy. On the other hand, Doordash and Postmates both have local networks effects, meaning that transactions within their 2-sided networks exist within specific cities, not across them. Consequently, winning in one geography, like Los Angeles, doesn’t confer an advantage in another location. City-by-city network effects are naturally more fragmented and suffer from more severe competition. In other words, winner-take-all-dynamics are nonexistent.
For food delivery and other marketplaces where fragmentation is the norm, competition is severe. There is little to no cost for users—both restaurants and consumers—to join a new platform. Restaurants are incentivized to join multiple platforms to tap into more potential demand, meaning no platform’s supply is unique. When consumers can order the same meal from multiple platforms, the providers then compete on price and experience (most notably delivery time).
5. Scaling the mountain is much harder than you think.
The Marketplace 100 reveals a number of themes—the strength of network effects, differentiated supply, consumer behavioral tailwinds, defensible distribution channels, and more—that fuel a business’s long-term viability and allow certain marketplaces to flourish.
The scatterplot below exhibits a stark reality: Even the most promising startups, by growth, must prove their staying power and endure a tumultuous climb to rival the scale of leaders like Airbnb, Doordash, Instacart, and Postmates. None of the top four fastest growing marketplaces—highlighted in orange below—have yet broken into the top 50 in terms of GMV. A categorical view illustrates why two of the top four marketplaces fall into the food & beverage category—it’s a leading category in both scale and growth. As with the fastest-growing companies, fast-growing categories must also prove the longevity of their underlying consumer behaviors.
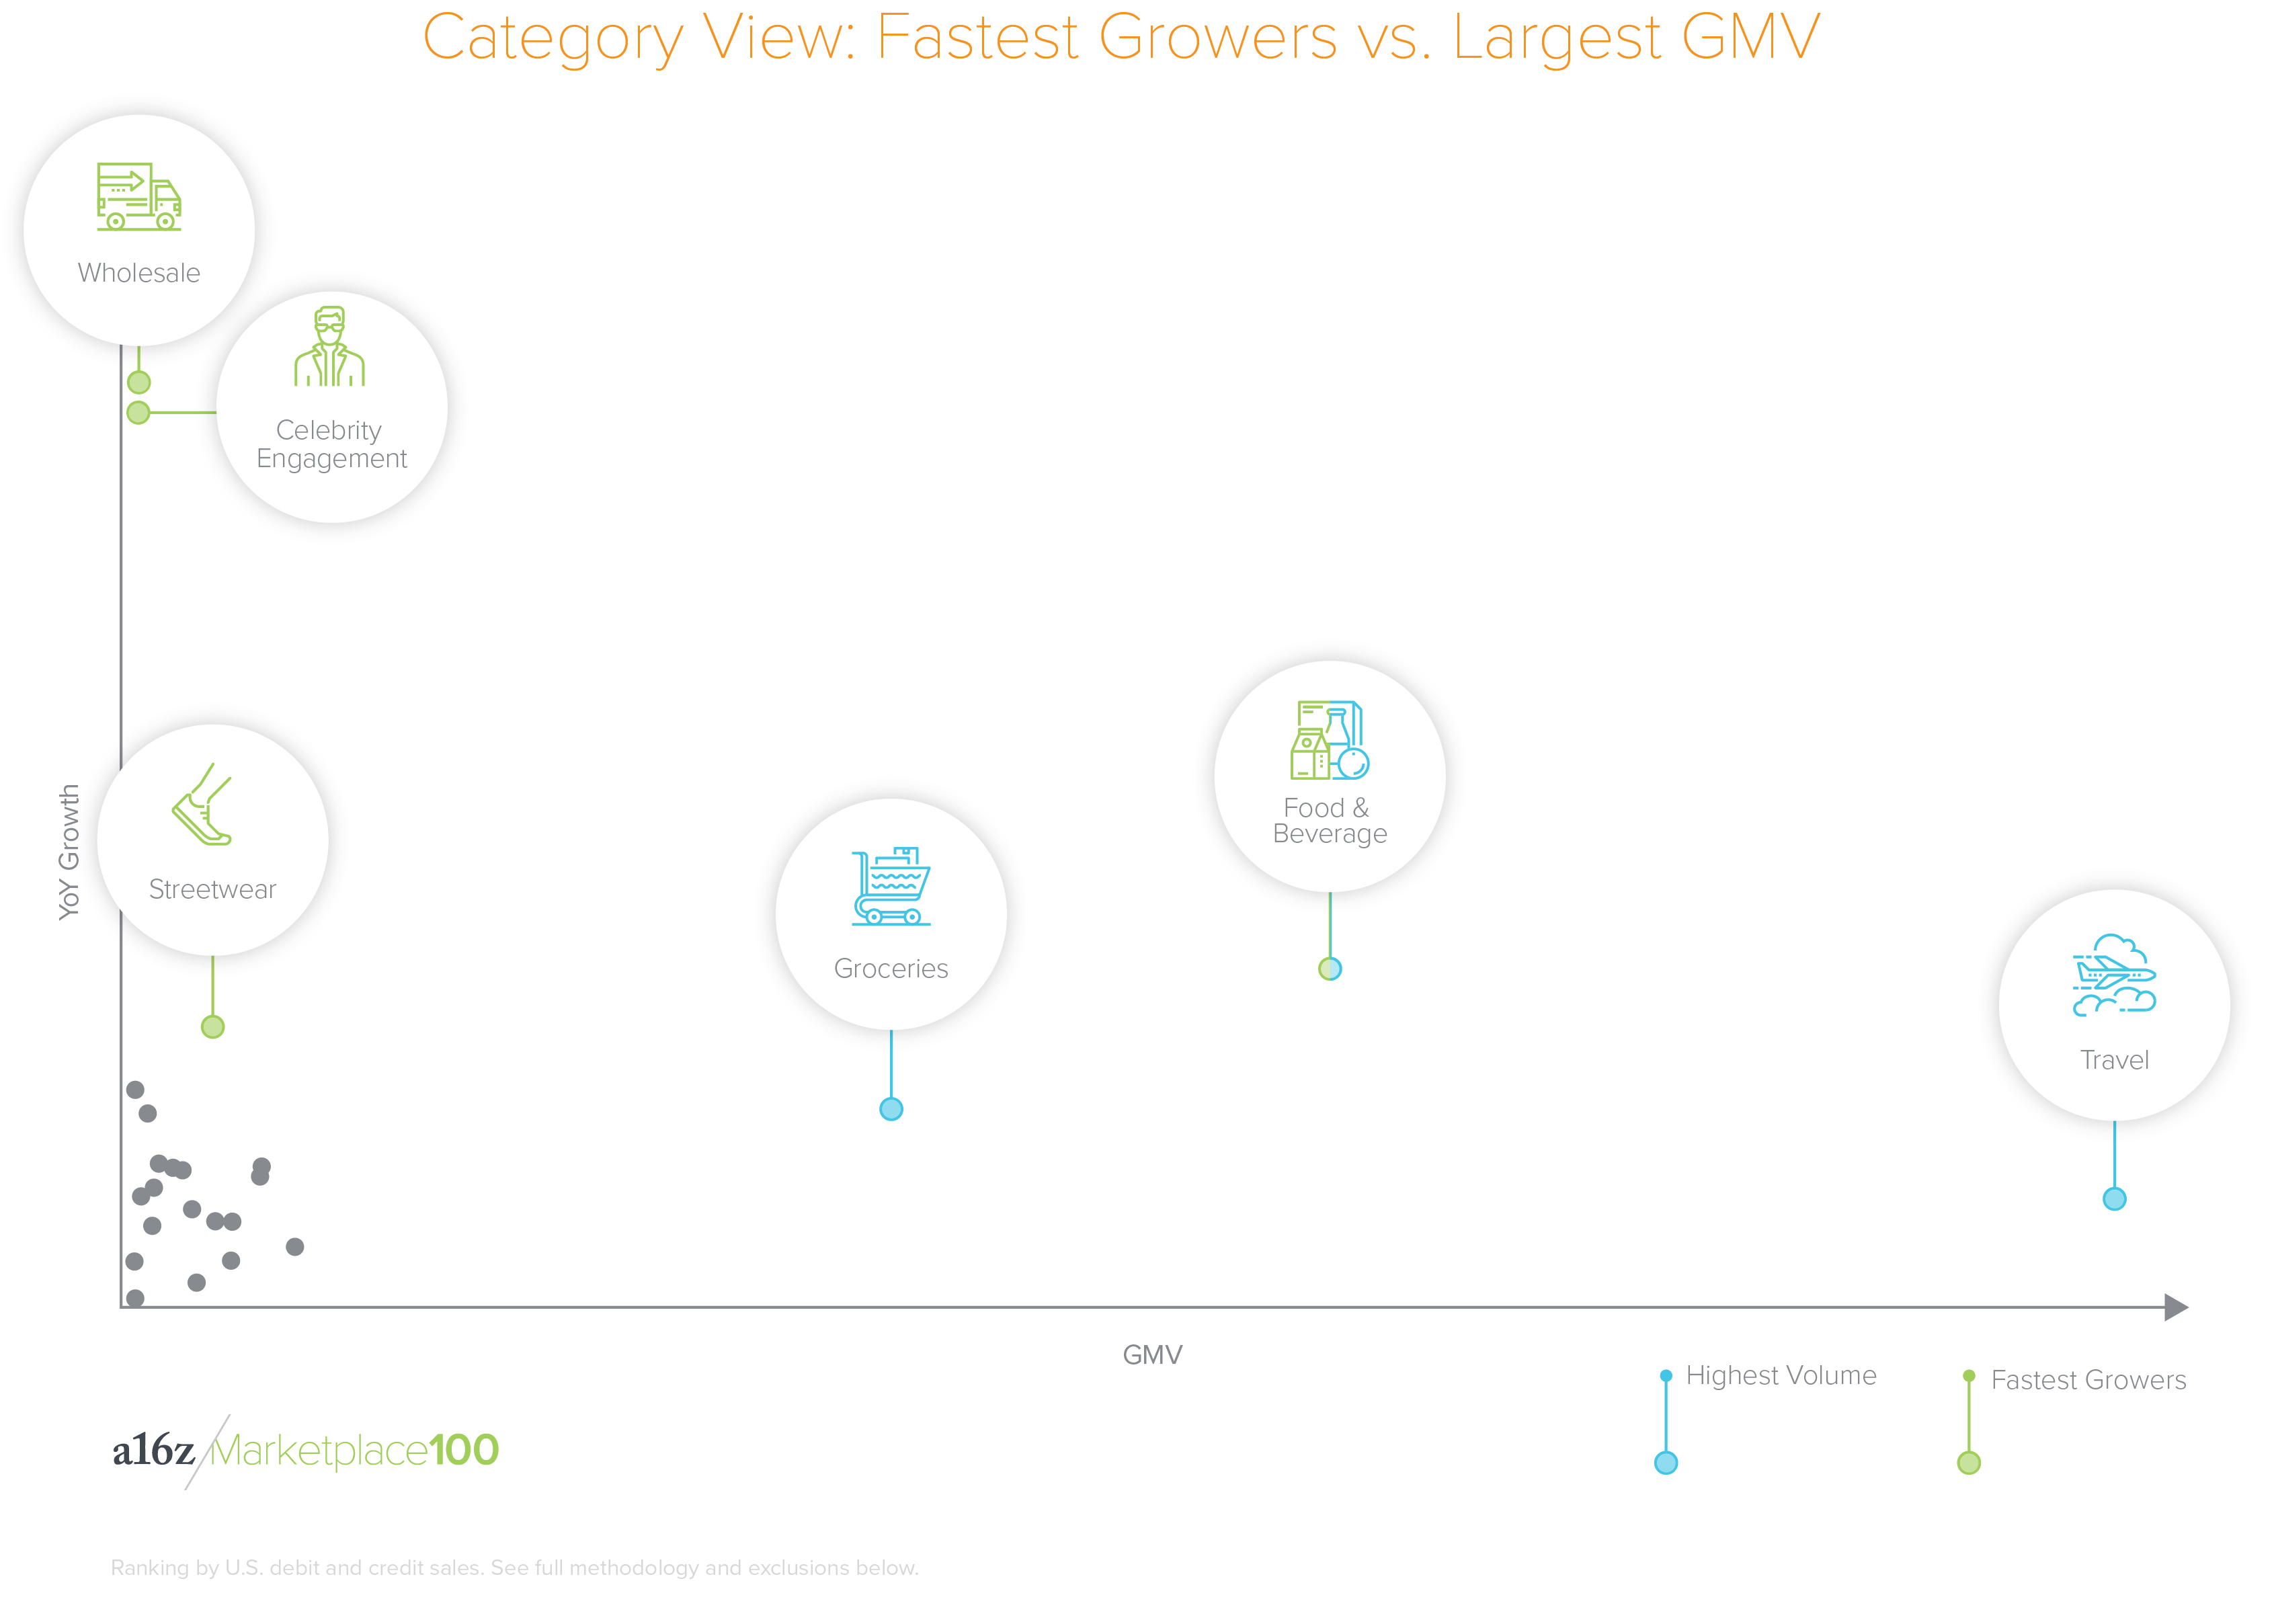 Marketplace startups represent a wide cross-section of emerging consumer behavior, from rare streetwear to celebrity shout-outs to on-demand…everything. But beyond macro trends, the data behind the Marketplace 100 provides key benchmarks for company building, including engagement, user acquisition, and retention. In addition, the resulting analysis offers insights into the types of business models that work for different types of products.
Over the following week, we’ll be delving deeper into this data to explore common questions that surround marketplace companies. What separates products that are used often—those apps you check obsessively—from those that you tap more like once a year? What makes some products particularly sticky among users over time, and others less so? What is the difference between homogeneous and heterogeneous supply, anyway—and why does it matter?
***
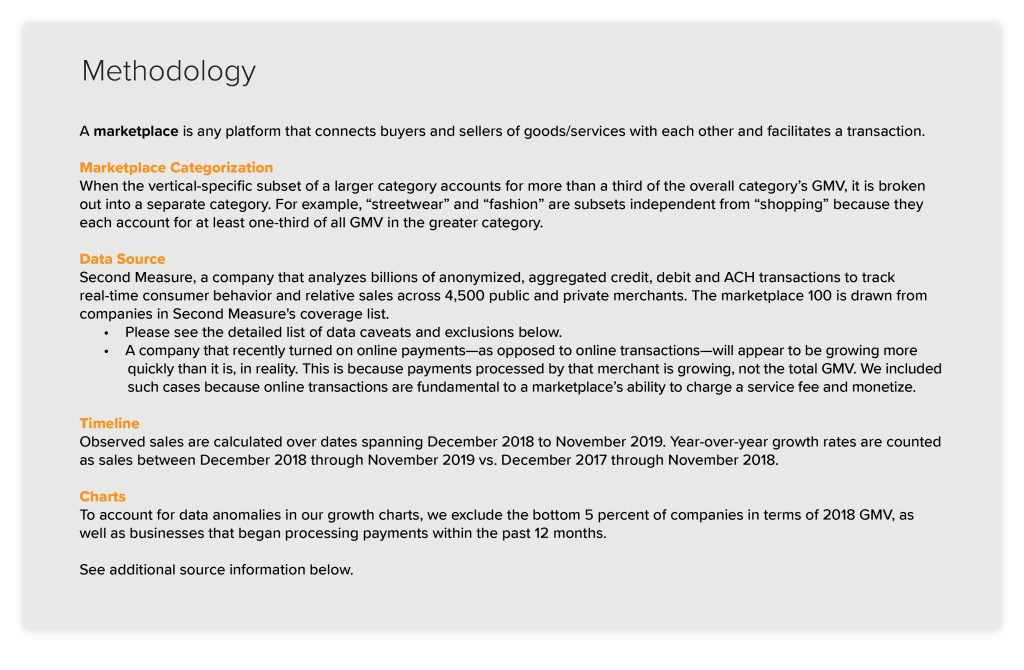
Methodology
A marketplace is any platform that connects buyers and sellers of goods/services with each other and facilitates a transaction.
Marketplace categorization: When the vertical-specific subset of a larger category accounts for more than a third of the overall category’s GMV, it is broken out into a separate category. For example, “streetwear” and “fashion” are subsets independent from “shopping” because they each account for at least one-third of all GMV in the greater category.
Data source: Second Measure , a company that analyzes billions of anonymized, aggregated credit, debit and ACH transactions to track real-time consumer behavior and relative sales across 4,500 public and private merchants. The marketplace 100 is drawn from companies in Second Measure’s coverage list.
- Second Measure data is made up of billions of anonymous U.S. consumers’ credit card, debit card, and bank transactions. It excludes non-U.S. consumers, business spending, receipt-level information, and payments made via cash, check, or EBT.
- Second Measure cannot reliably attribute bundled revenue streams.
- Tips are not reliably differentiated from purchases on marketplaces and may be included in some merchants’ GMV.
- Second Measure does not observe revenue from third-party retailers or other B2B revenue streams.
- Second Measure does not observe spending made with gift cards.
- Second Measure cannot reliably attribute purchases financed through third-party companies like Prosper and Affirm to the marketplace associated with the purchase.
- Second Measure cannot reliably observe spending financed through credits from selling on a marketplace.
- Second Measure does not observe revenue from corporate benefits partnership programs.
- Transactions correspond to some companies’ Gross Merchandise Volume, a significant portion of which is not revenue to the company.
- Second Measure does not observe online payments through iTunes or the Apple Store.
- Second Measure cannot reliably observe marketplace fees.
- Second Measure does not observe marketplace revenue generated by third-party referrals.
- Companies that recently turned on online payments—as opposed to online transactions—will appear to be growing more quickly than it is, in reality. This is because payments processed by that merchant is growing, not the total GMV. We included such cases because online transactions are fundamental to a marketplace’s ability to charge a service fee and monetize.
- There may exist companies that meet the criteria of the Marketplace 100, but they are not included because they are not on Second Measure’s coverage list.
Timeline: Observed sales are calculated over dates spanning December 2018 to November 2019. Year-over-year growth rates are counted as sales between December 2018 through November 2019 vs. December 2017 through November 2018.
Charts: To account for data anomalies in our growth charts, we exclude the bottom 5 percent of companies in terms of 2018 GMV, as well as businesses that began processing payments with the past 12 months.
***
The views expressed here are those of the individual AH Capital Management, L.L.C. (“a16z”) personnel quoted and are not the views of a16z or its affiliates. Certain information contained in here has been obtained from third-party sources, including from portfolio companies of funds managed by a16z. While taken from sources believed to be reliable, a16z has not independently verified such information and makes no representations about the enduring accuracy of the information or its appropriateness for a given situation.
This content is provided for informational purposes only, and should not be relied upon as legal, business, investment, or tax advice. You should consult your own advisers as to those matters. References to any securities or digital assets are for illustrative purposes only, and do not constitute an investment recommendation or offer to provide investment advisory services. Furthermore, this content is not directed at nor intended for use by any investors or prospective investors, and may not under any circumstances be relied upon when making a decision to invest in any fund managed by a16z. (An offering to invest in an a16z fund will be made only by the private placement memorandum, subscription agreement, and other relevant documentation of any such fund and should be read in their entirety.) Any investments or portfolio companies mentioned, referred to, or described are not representative of all investments in vehicles managed by a16z, and there can be no assurance that the investments will be profitable or that other investments made in the future will have similar characteristics or results. A list of investments made by funds managed by Andreessen Horowitz (excluding investments for which the issuer has not provided permission for a16z to disclose publicly as well as unannounced investments in publicly traded digital assets) is available at https://a16z.com/investments/
Charts and graphs provided within are for informational purposes solely and should not be relied upon when making any investment decision. Past performance is not indicative of future results. The content speaks only as of the date indicated. Any projections, estimates, forecasts, targets, prospects, and/or opinions expressed in these materials are subject to change without notice and may differ or be contrary to opinions expressed by others. Please see https://a16z.com/disclosures for additional important information.

