NFTs offer creators a new way to earn a living online. The technology, which has several applications, allows creators to appeal directly to fans for patronage — without having to rely only on extractive, ad-based, centralized platforms as intermediaries.
But it’s important that creators take special care when setting the initial parameters for their NFT mints (the process that puts their work on a blockchain, allowing it to be sold and more). This is because these early decisions can affect the viability, and vitality, of their projects.
To share some early data that may offer creators some insights across projects besides their own, I analyzed minting data from the top 150 NFT collections on OpenSea, the popular NFT marketplace [disclosure: an a16z crypto portfolio company]. Here are some benchmarks and quick takeaways from that data, based on a new dashboard that I created on Dune Analytics:
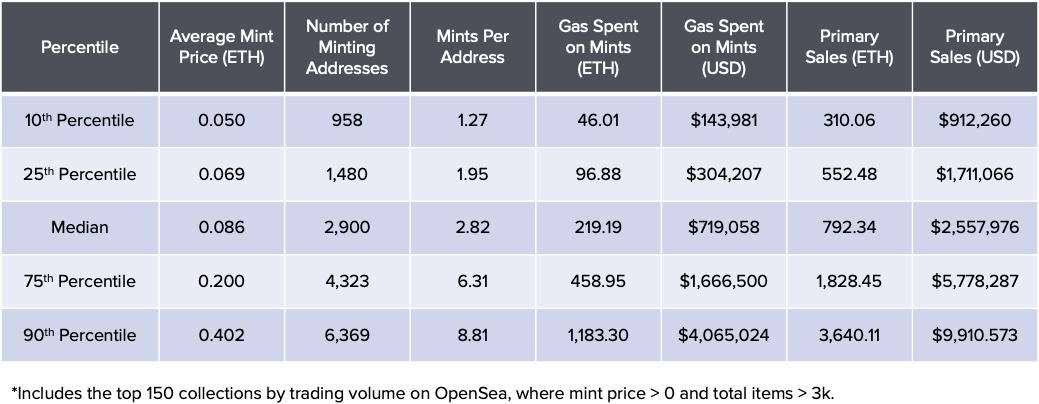
NFT mint price
Choosing an “ideal” NFT mint price is key. A higher initial price means more revenue gets generated up front, assuming there is enough demand. But a higher initial price will also dampen the potential returns for a creator’s earliest backers, which could impact the volume of secondary sales. (Creators being able to easily receive royalties from secondary sales is one of the benefits of NFTs.)
According to the data set, NFT collections with mint prices set greater than 0.25 ETH have rarely achieved returns greater than 10x. Only two collections succeeded in doing so: Azuki Zen, which had an average mint price of 0.94 ETH; and Invisible Friends, which was sold at a fixed price of 0.25 ETH. (At the time of writing, their floor prices were respectively 6.4 ETH and 19.5 ETH.)
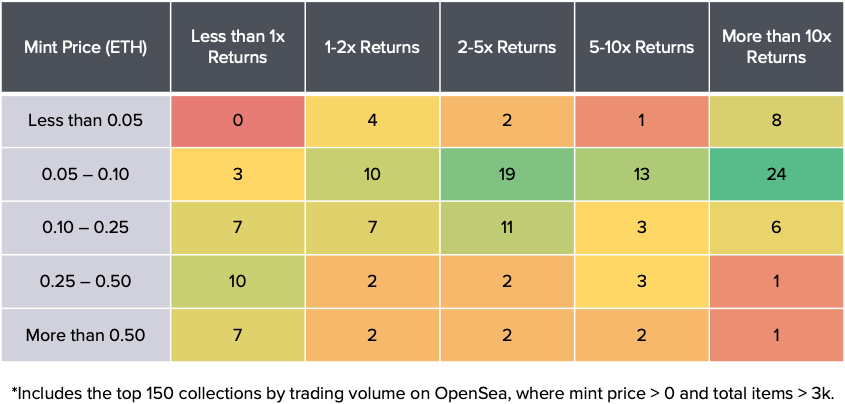
Most commonly, the best performing NFT collections in terms of returns — to be clear, there are more criteria for evaluating success than price! — were initially priced in the 0.05-to-0.10 ETH range. These included high-profile projects like Bored Ape Yacht Club and World of Women.
Mint price is the easiest lever NFT creators have, and it can have a big influence on market dynamics later on.
Market volume
Many of the most successful NFT projects raised less than $5 million in the mint. In fact, in this data set, there was a negative correlation between primary sales revenue and performance since mint, as seen in the chart below:
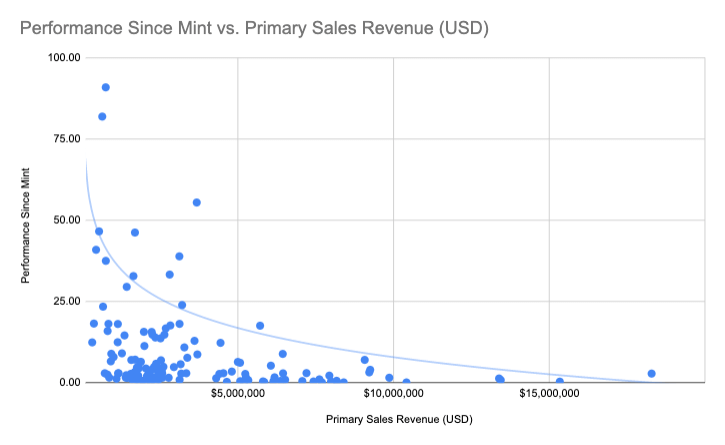
Why the negative correlation? One reason is that it is just harder to generate higher multiples on a larger base. Going from a price of 0.02 ETH to 0.20 ETH is much easier than going from 0.50 ETH to 5.00 ETH, in other words.
Another reason why we might see a negative correlation: Creators who land large amounts of upfront revenue could become less incentivized to focus on a project’s long-term success. It’s akin to a misaligned compensation plan for a startup founder. If a founder has already scored a massive payday, why stick around for years and continue to grind away at the trouble of business building?
Primary sales revenue and secondary trading volume display a similar negative correlation. As it turns out, many projects that raised very little in the mint have seen significant traction in the secondary markets. (The overall correlation is a bit less pronounced than in the case above, so I excluded the trend line in the chart below.)
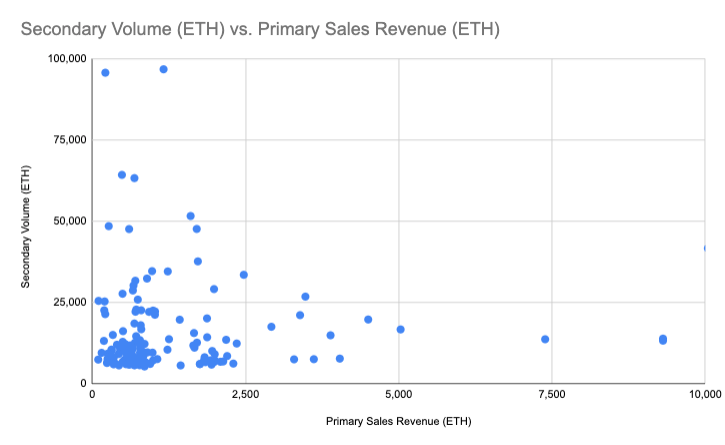
While primary sales may be the dominant source of creator revenues today, a project’s long-term success will depend on a sustainable secondary market, and an engaged community. Of course, a large majority of the NFT market is still less than a year old, so the data (and anyone’s ability to extrapolate from it) has limits.
Wallet caps
Another question creators face is whether to limit the number of mints per on-chain address. Do projects with fewer mints per address see higher returns? The answer, based on this data set, appears to be no.
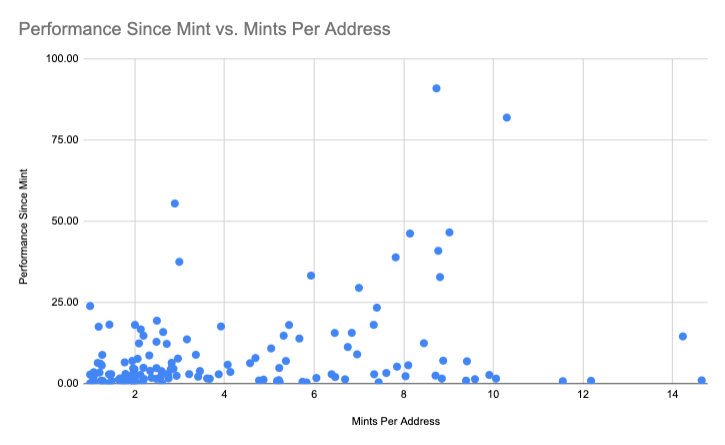
Many of the best performers had, on average, 5-to-10 mints per address. Some of these included Meebits, Doodles, and Cool Cats.
tl;dr
- Low mint prices correlated to higher return multiples for early backers
- Many of today’s most vibrant secondary markets had very little in primary sales revenue
- There has been a “sweet spot” of 5-to-10 mints per address for top performing collections
Those are just a few quick takeaways. Of course, every creator and every project is different. The design of an NFT drop is way more art than science. But hopefully these data benchmarks can help inform NFT creators’ key decisions, at least until the community develops and shares more best practices around them. I also published a dashboard on Dune Analytics so anyone can view these metrics for any given NFT collection; you can use this tool to view the metrics discussed above for a given NFT collection. Just enter the contract address and explore!
To dig into the data yourself, go to the dashboard.