
“How to hit home runs: I swing as hard as I can, and I try to swing right through the ball… The harder you grip the bat, the more you can swing it through the ball, and the farther the ball will go. I swing big, with everything I’ve got. I hit big or I miss big.” –Babe Ruth
One of the hardest concepts to internalize for those new to VC is what is known as the “Babe Ruth effect”:
“Building a portfolio that can deliver superior performance requires that you evaluate each investment using expected value analysis. What is striking is that the leading thinkers across varied fields — including horse betting, casino gambling, and investing — all emphasize the same point. We call it the Babe Ruth effect: even though Ruth struck out a lot, he was one of baseball’s greatest hitters.” –The Babe Ruth Effect: Frequency vs Magnitude [pdf]
The Babe Ruth effect occurs in many categories of investing, but is especially pronounced in VC. As Peter Thiel observes:
“Actual [venture capital] returns are incredibly skewed. The more a VC understands this skew pattern, the better the VC. Bad VCs tend to think the dashed line is flat, i.e. that all companies are created equal, and some just fail, spin wheels, or grow. In reality you get a power law distribution.”
The Babe Ruth effect is hard to internalize because people are generally predisposed to avoid losses. Behavioral economists have famously demonstrated that people feel a lot worse about losses of a given size than they feel good about gains of the same size. Losing money feels bad, even if it is part of an investment strategy that succeeds in aggregate.
People usually cite anecdotal cases when discussing this topic, because it’s difficult to get access to comprehensive VC performance data. Horsley Bridge, a highly respected investor (Limited Partner) in many VC funds, was kind enough to share with me aggregated, anonymous, historical data on the distribution of investment returns across the hundreds of VC funds they’ve invested in since 1985.
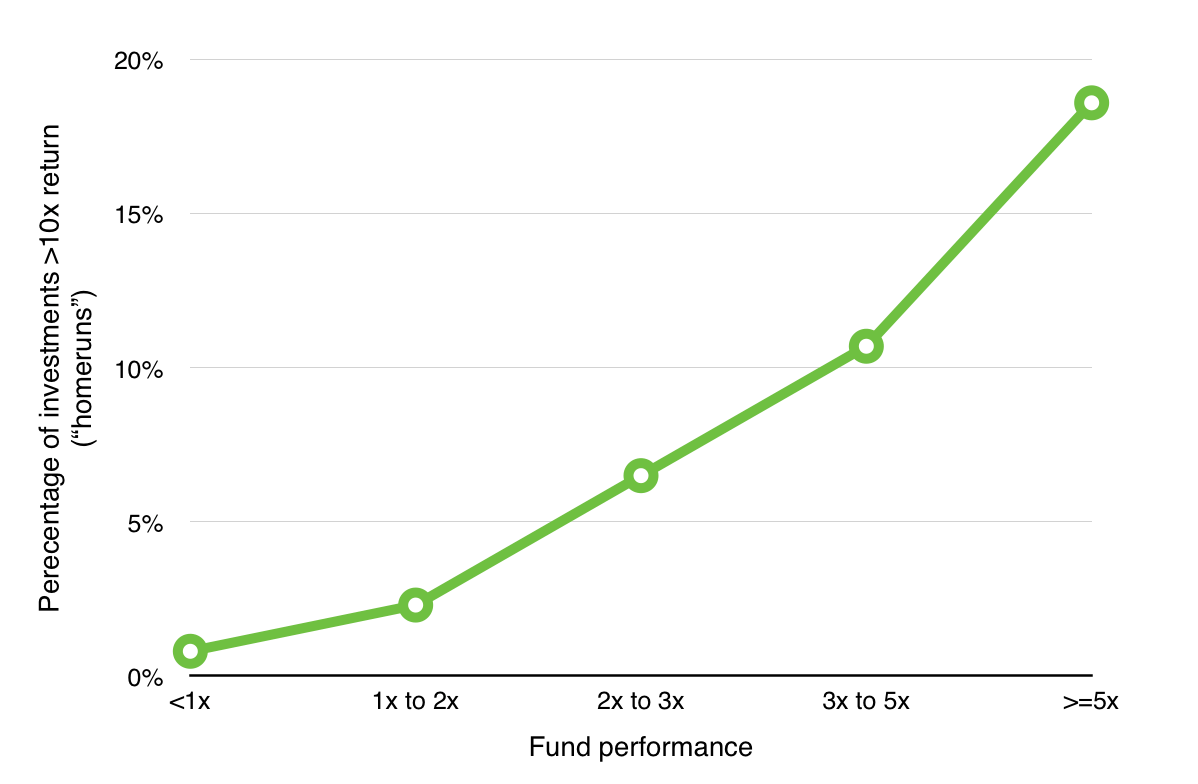
As expected, the returns are highly concentrated: about ~6% of investments representing 4.5% of dollars invested generated ~60% of the total returns. Let’s dig into the data a little more to see what separates good VC funds from bad VC funds. (For all the charts shown below, the X-axis is the performance of the VC funds: great VC funds are on the right and bad funds are on the left.)
Home runs. As expected, successful funds have more “home run” investments (defined as investments that return >10x):
Great funds not only have more home runs, they have home runs of greater magnitude. Here’s a chart that looks at the average performance of the “home run” (>10x) investments:
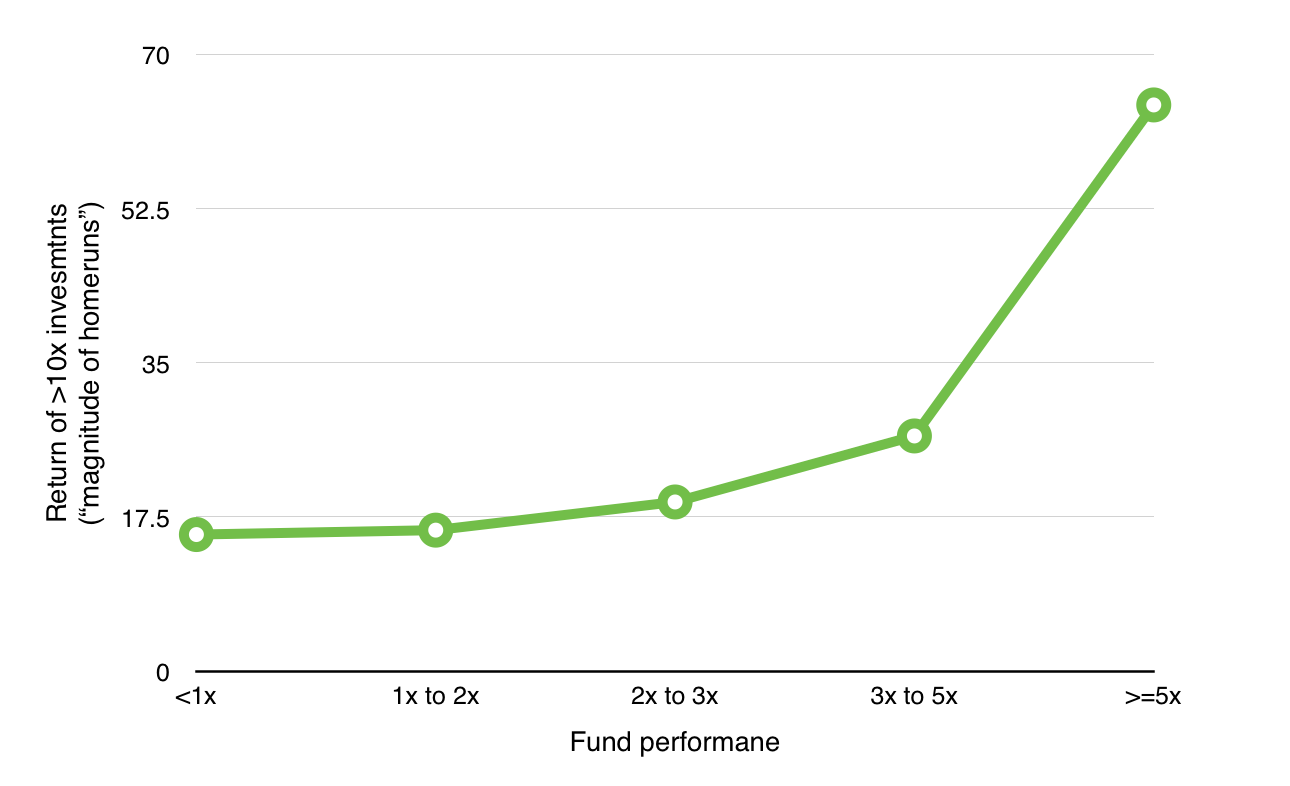
The home runs for good funds are around 20x, but the home runs for great funds are almost 70x. As Bill Gurley says: “Venture capital is not even a home run business. It’s a grand slam business.”
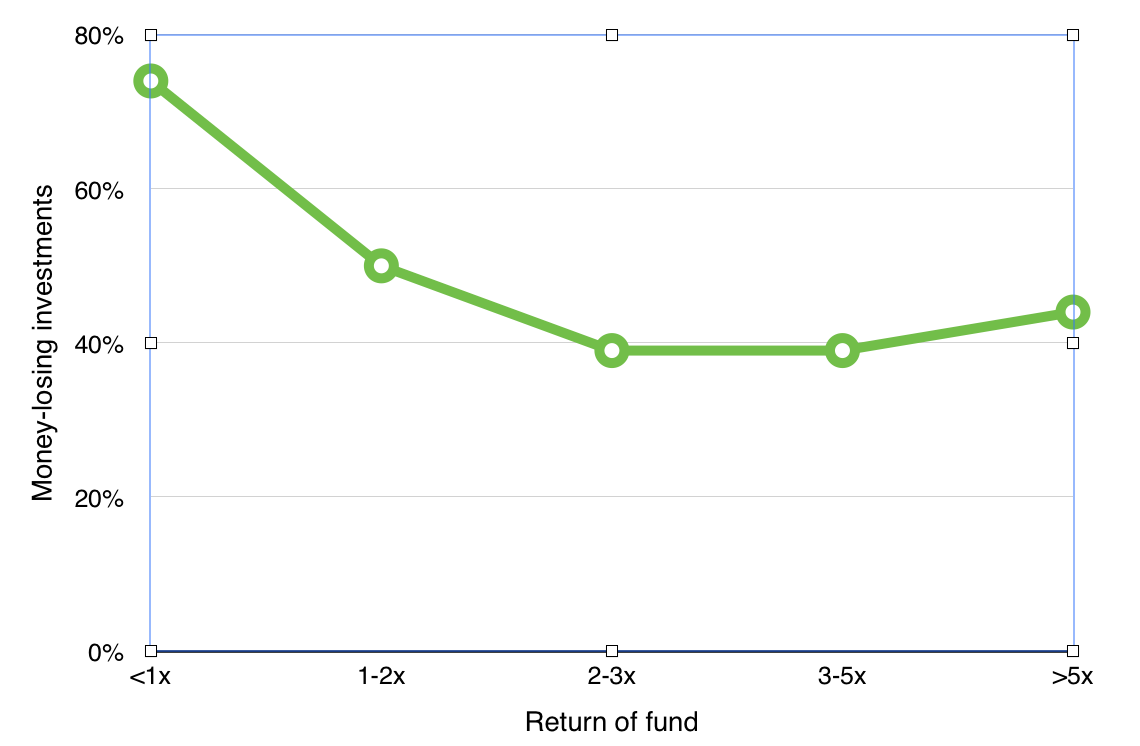
Strikeouts. The Y-axis on the this chart is the percentage of investments that lose money:
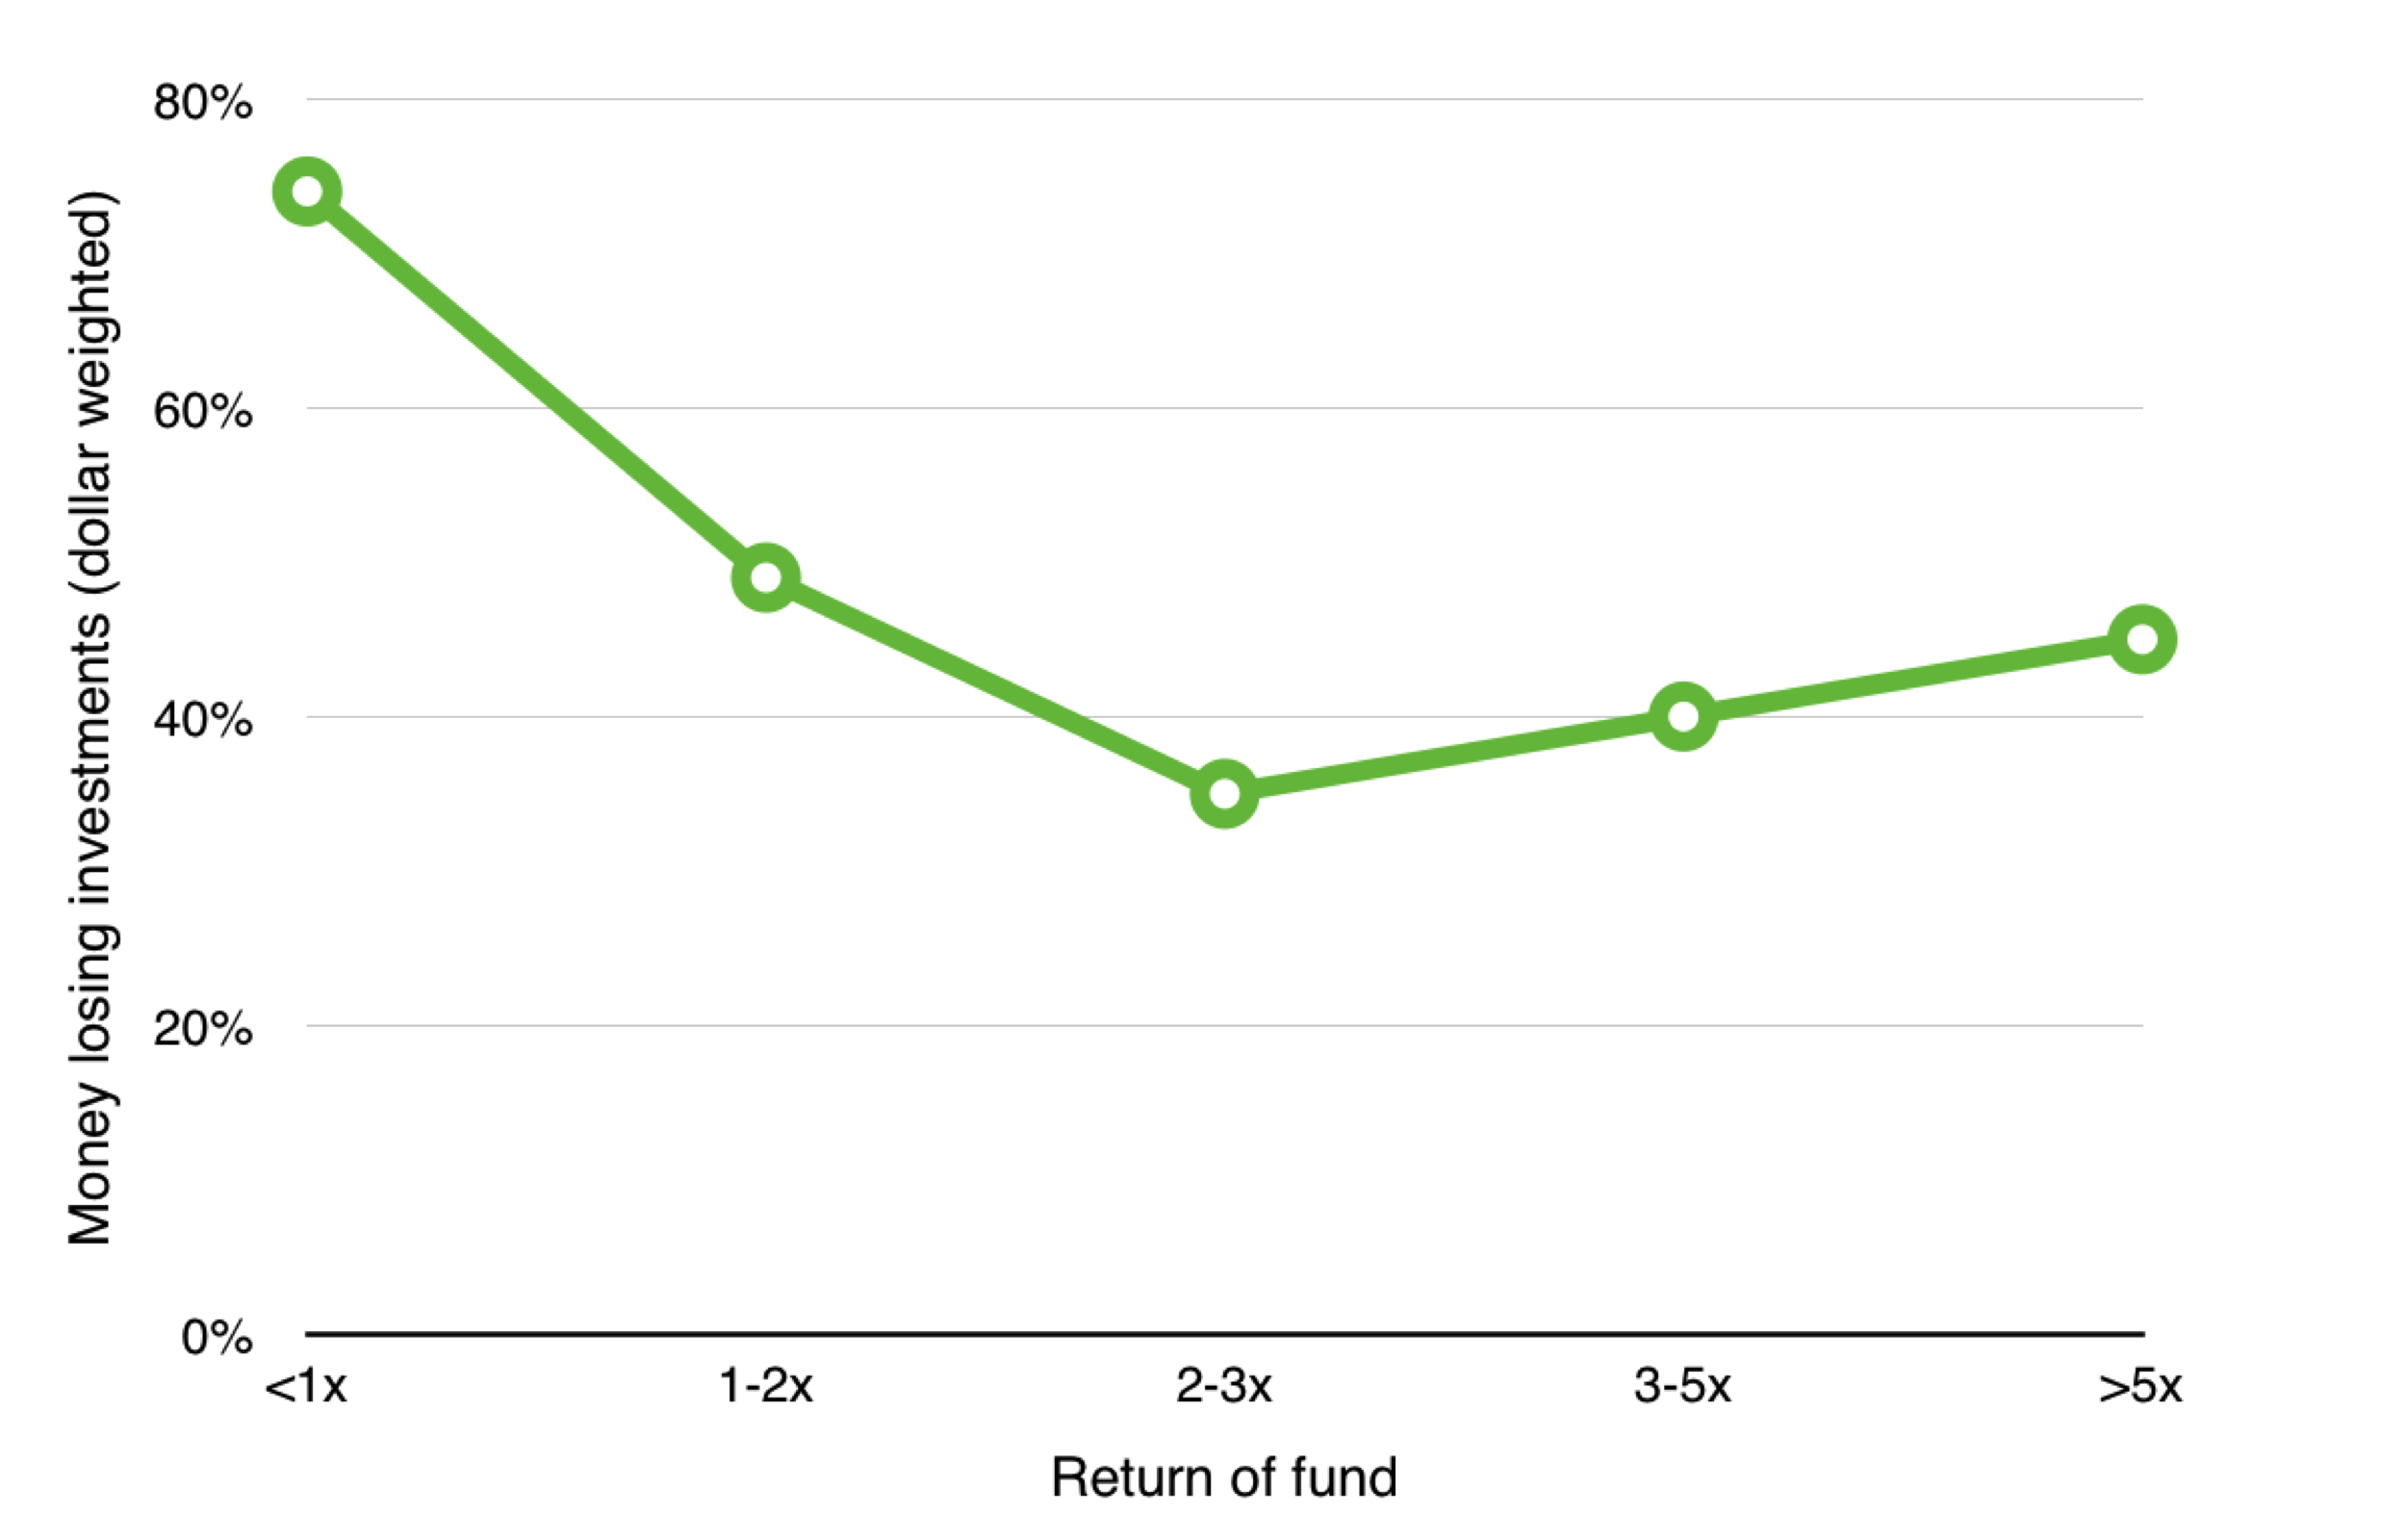
Here’s the same chart with the Y-axis weighted by dollars invested per investment:
As expected, lots of investments lose money. Venture capital is a risky business.
Notice that the curves are U-shaped. It isn’t surprising that the bad funds lose money a lot, or that the good funds lose money less often than the bad funds. What is interesting and perhaps surprising is that the great funds lose money more often than good funds do.
The best VCs funds truly do exemplify the Babe Ruth effect: they swing hard, and either hit big or miss big. You can’t have grand slams without a lot of strikeouts.

