
The Stickiest, Most Addictive, Most Engaging, and Fastest-Growing Social Apps—and How to Measure Them
When a social app is working, it’s often clear in the data: how many people are using the app on a daily, weekly, or monthly basis and how is the network growth trending over time? But evaluating the success—or, in our case, the potential—of a social app is not as straightforward as it seems. What does “good” look like, anyway? How do various categories of social apps stack up in terms of engagement, stickiness, and retention (and which KPIs are most important to track)? Can upstarts compete with the reigning social giants?
To answer these pressing questions, we took a deep dive into the top social apps across a dozen categories, in partnership with the app intelligence software company Apptopia.
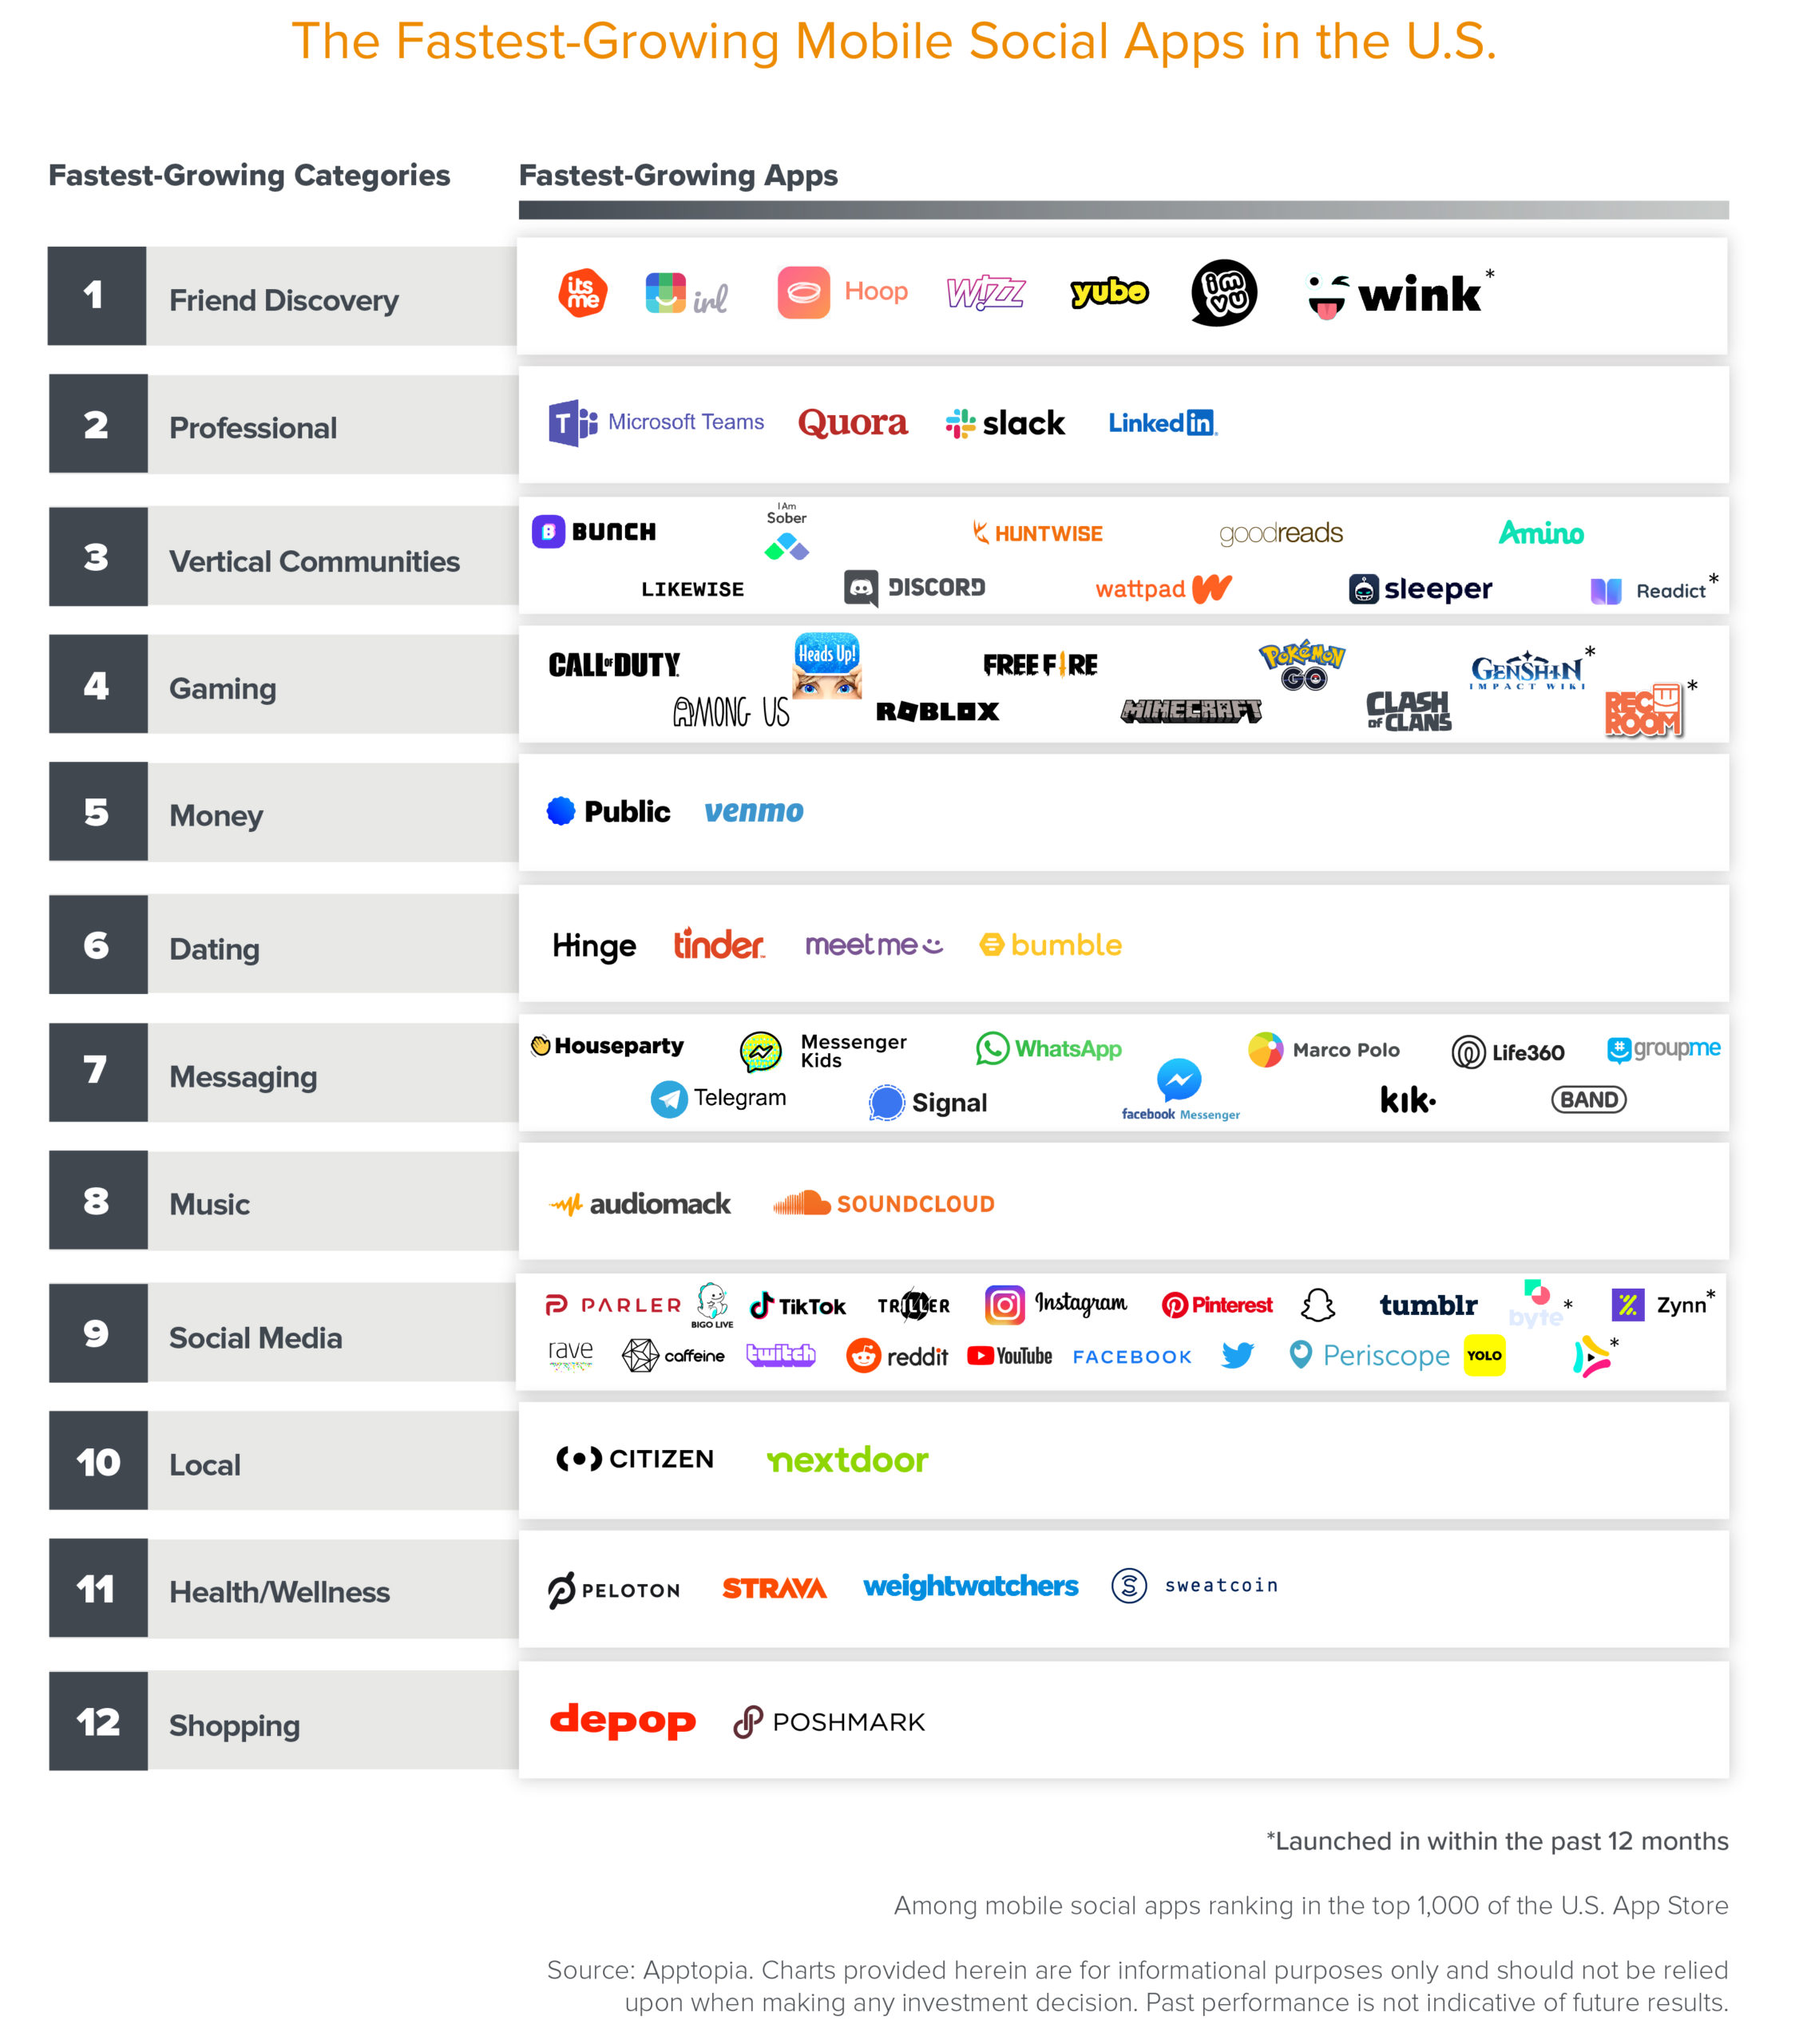
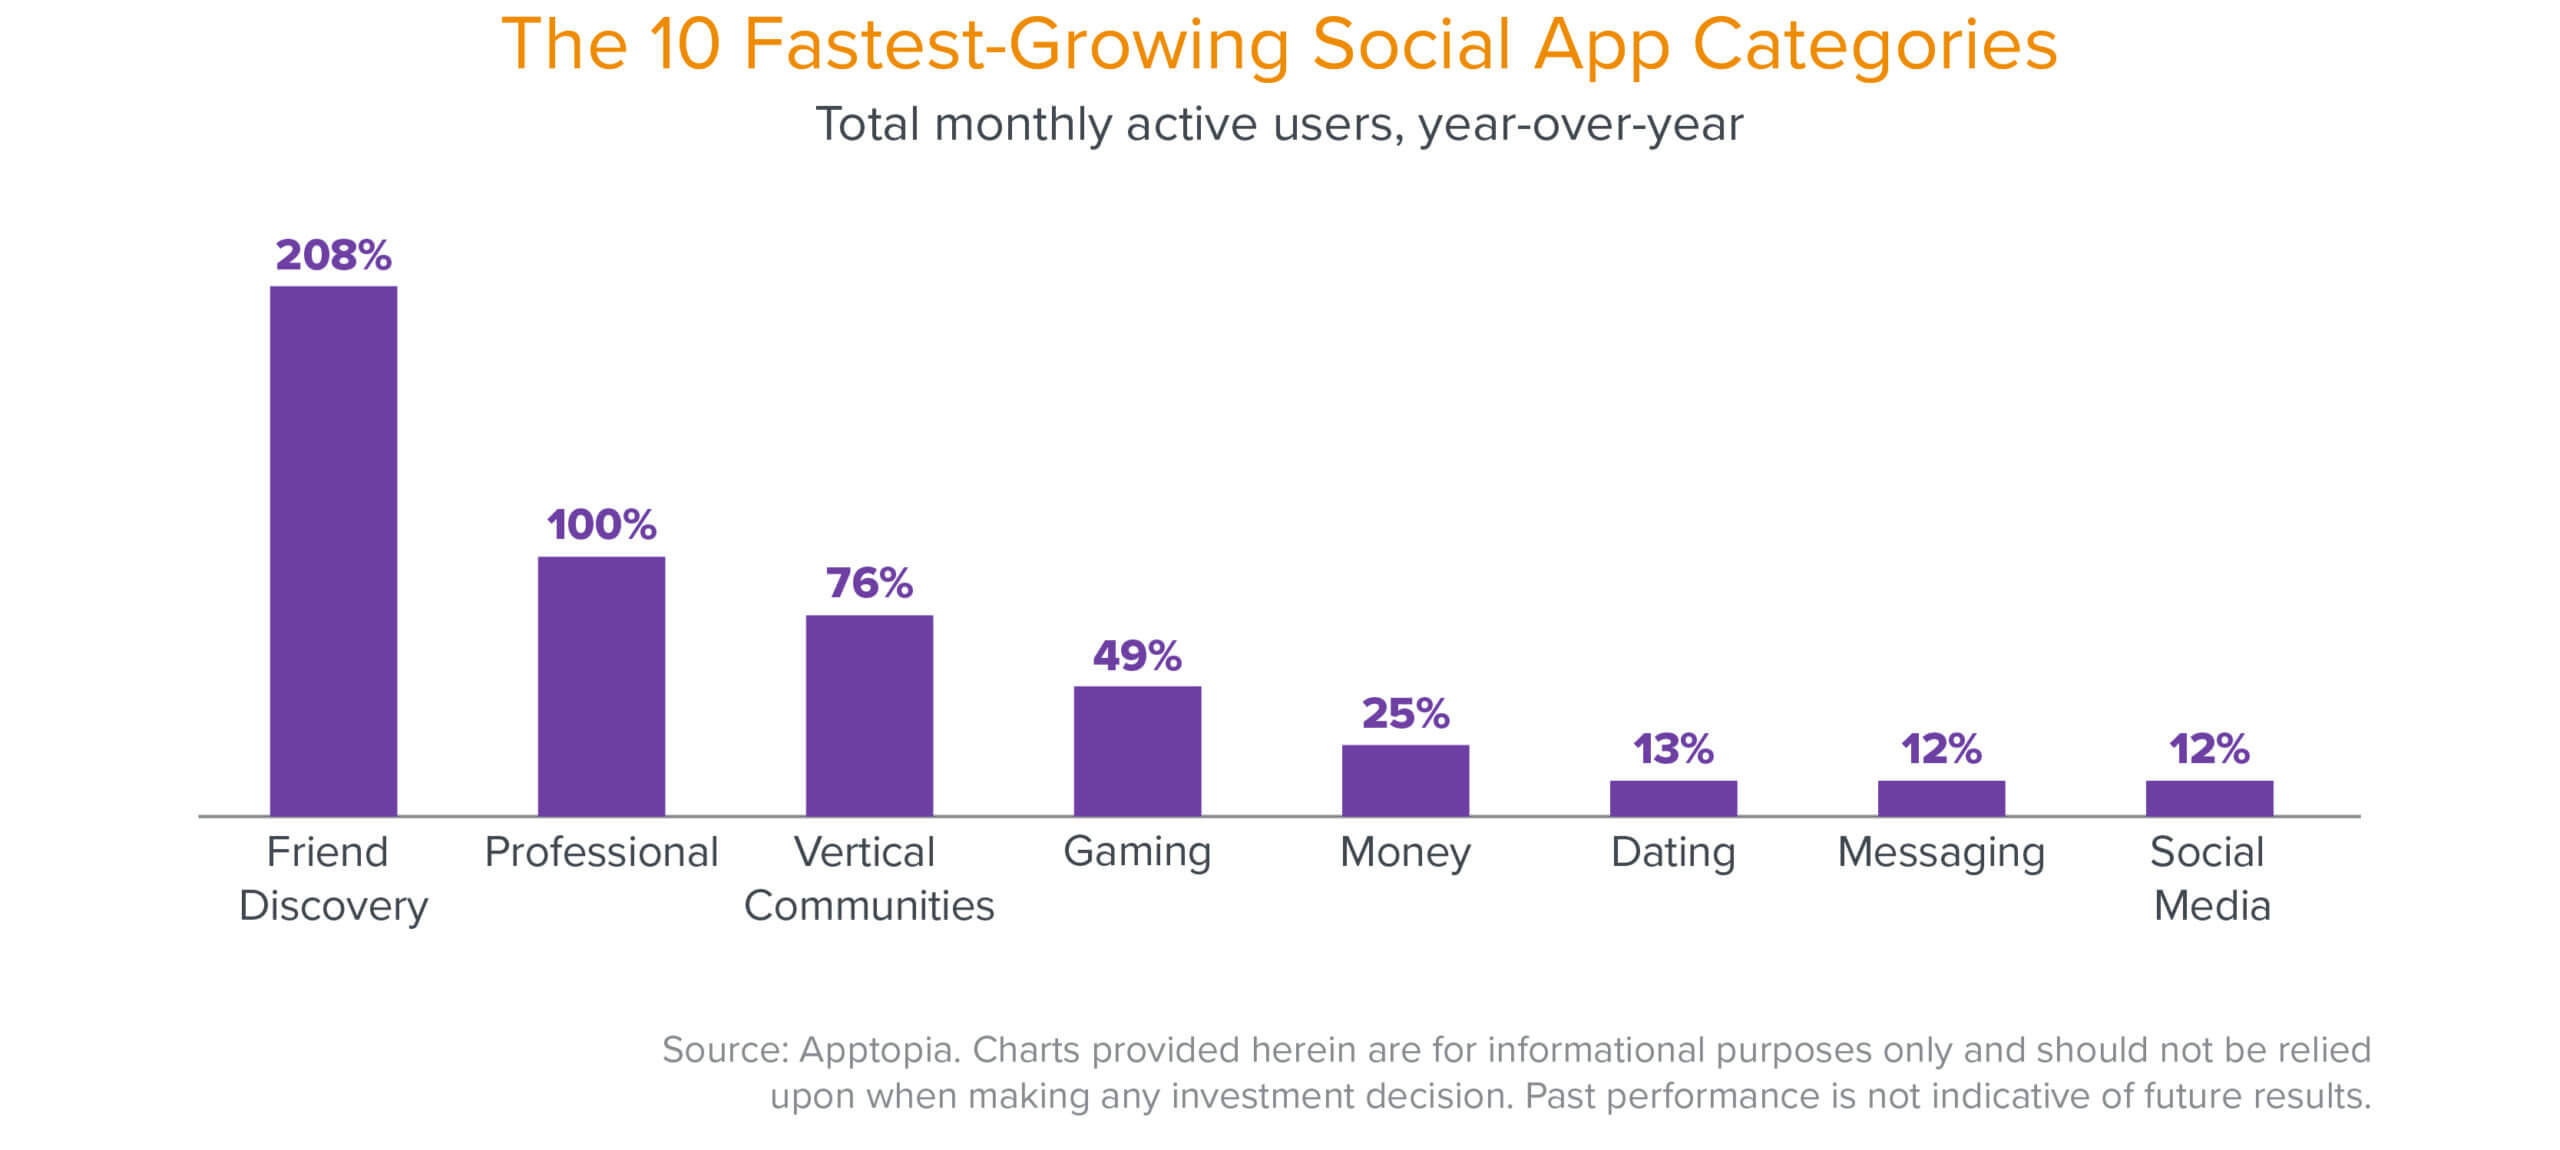
Of course, many of the top 100 social apps are well-known. But beyond the big names you might expect—Facebook, Instagram, TikTok, Pinterest, and Twitter among them—a number of up-and-coming startups in our analysis are not yet mainstream. In the graphic below, we ranked the fastest growing social categories, as well as the fastest growing companies therein, according to year-over-year monthly active users.
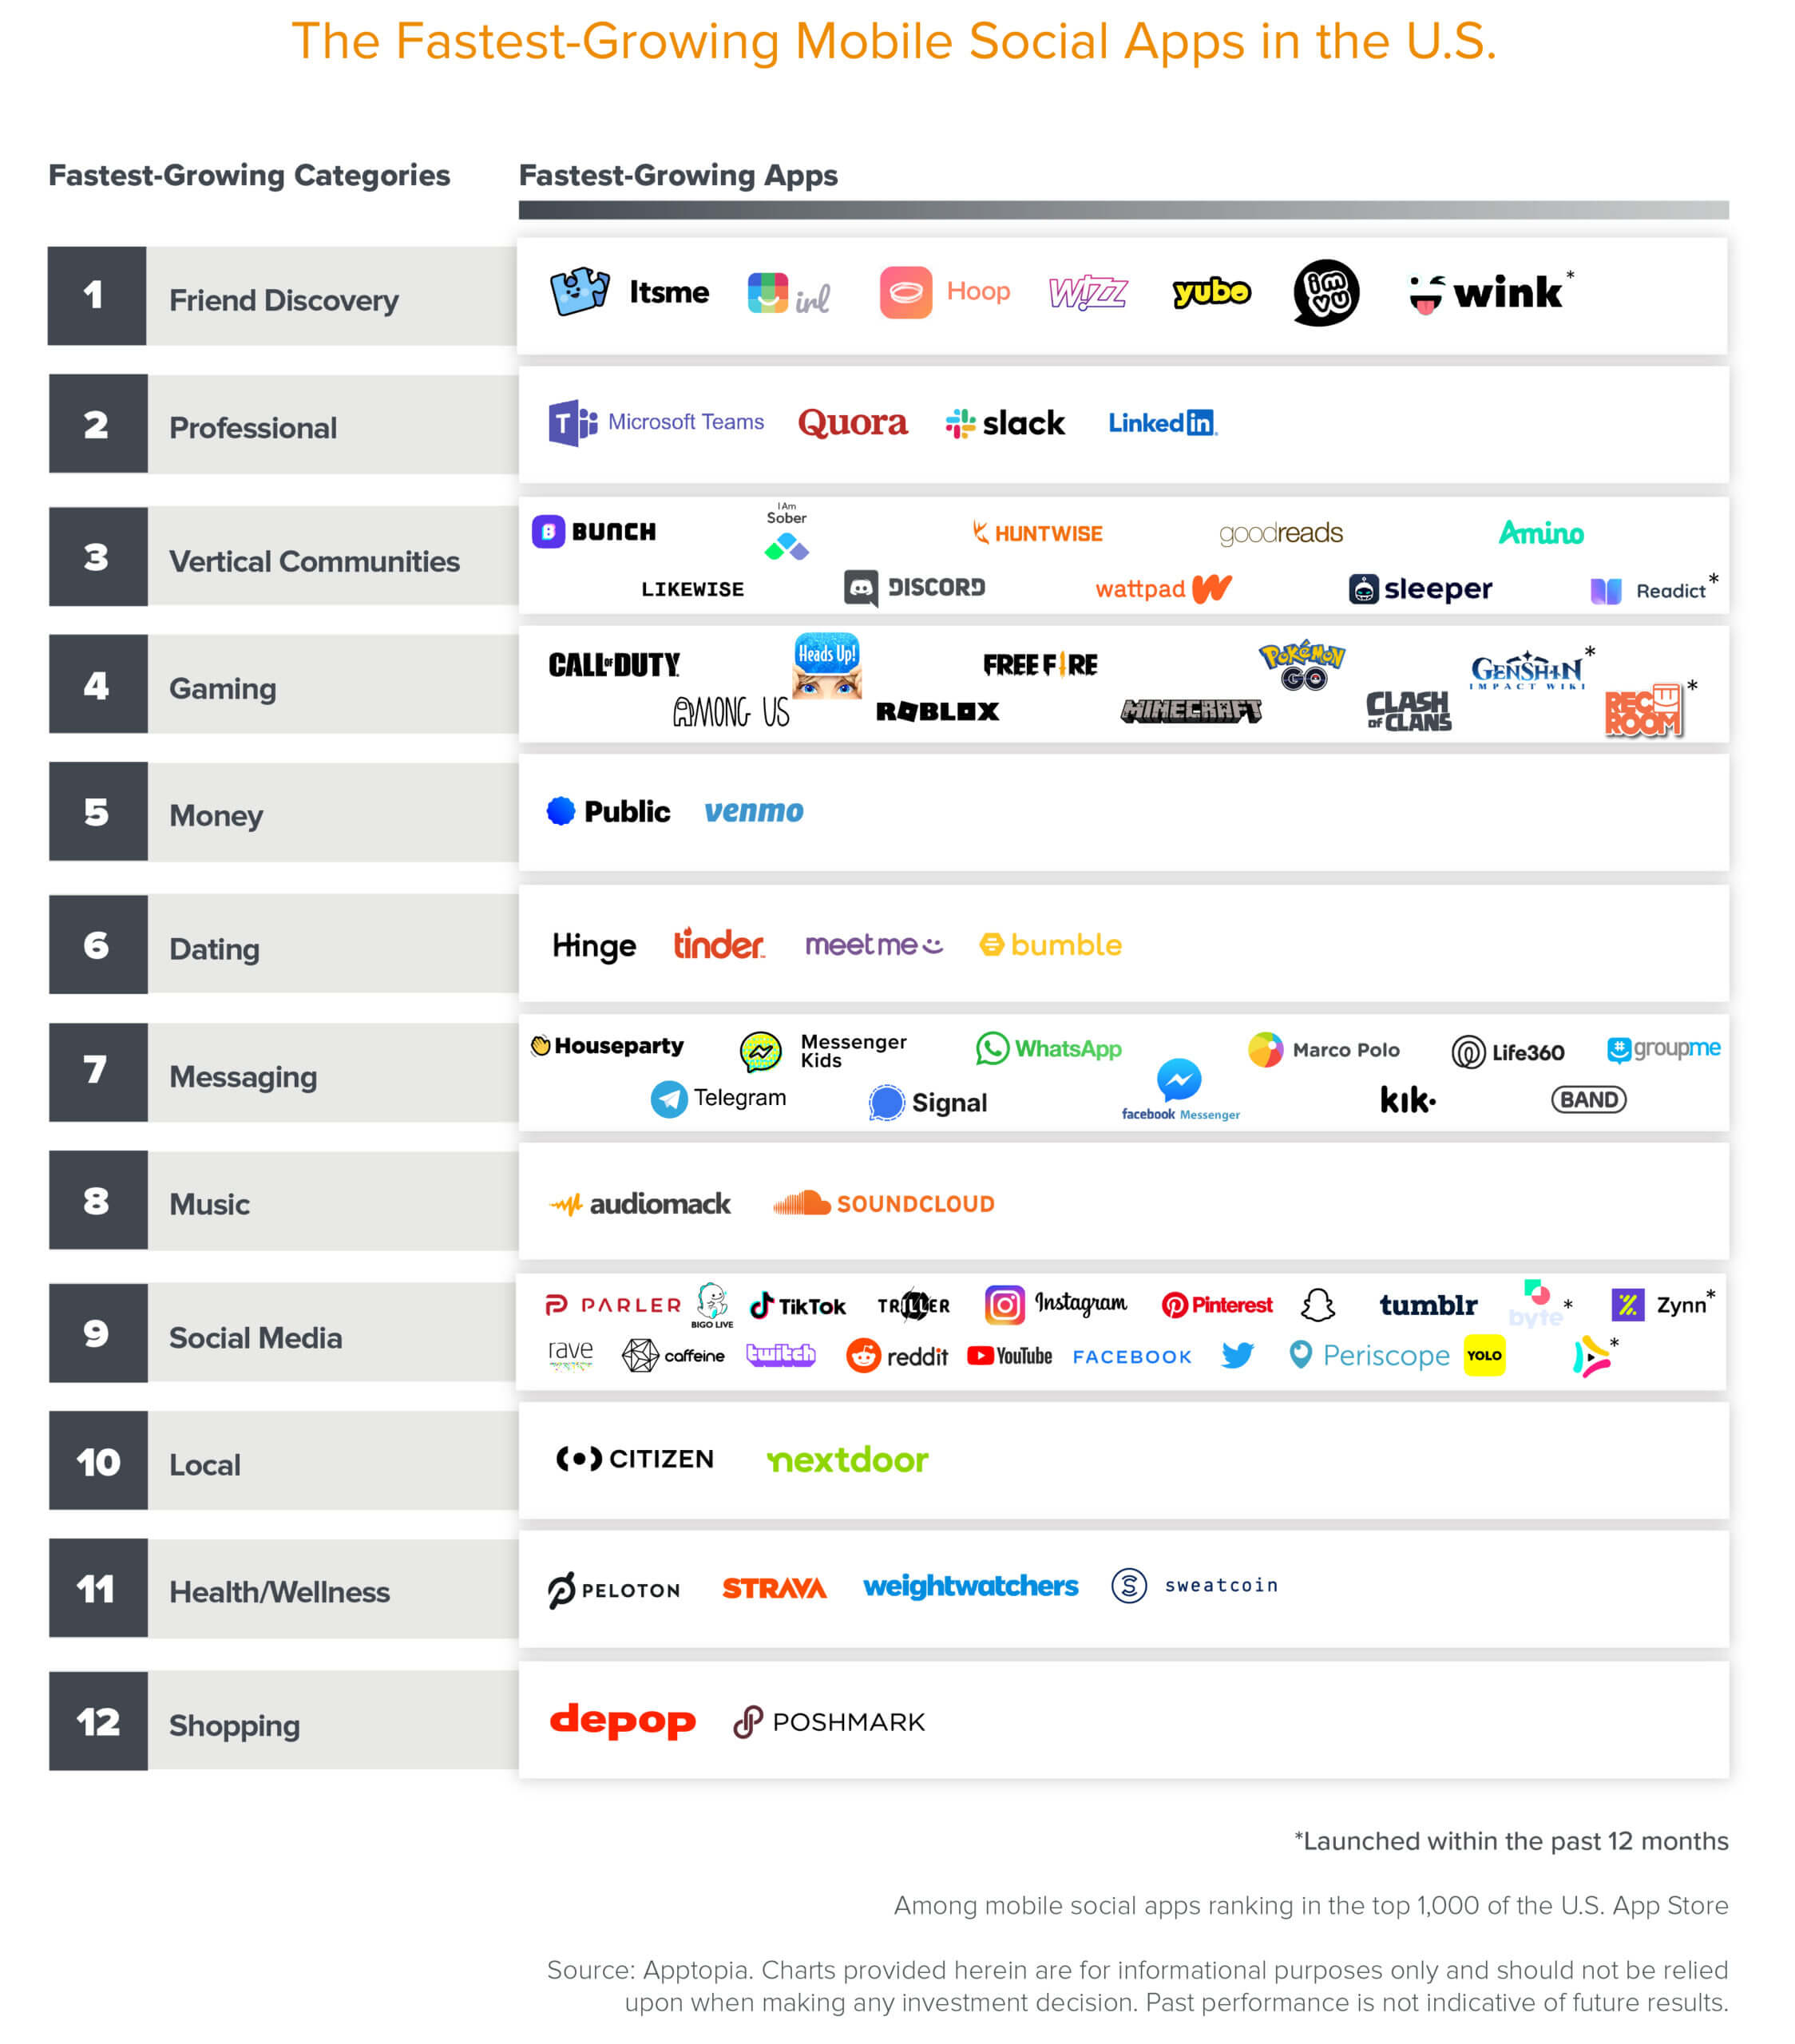
Currently, two of the fastest growing categories across the social app ecosystem are friend discovery (platforms that allow members to discover and connect with one another, often through common interests) and vertical communities (those that enable further engagement around specific subjects or activities). This illustrates what I believe the future of social will look like: interest-based platforms that drive meaningful new relationships. Friend discovery app Itsme, for example, lets users have synchronous conversations while showcasing their personalities through avatars. The platform aims to foster more intimate connections among users without the stressors (or privacy considerations) of a video chat.
Meanwhile, fast-growing vertical communities like Public and Bunch bring users together around shared interests—in this case, stock market investing and gaming, respectively. Users can delve into their hobbies and passions with niche-tailored product features, and discover a community of like-minded people in the process. Like going to the public park to play basketball, taking your dog to a dog park or joining a book club, these interest-based digital spaces can organically lead to new social connections. While it’s too early to tell which of the apps above will break out and achieve meaningful scale, this categorical lens is instructive in signaling broader trends. In the future, more and more of these formerly IRL social activities can and will exist online.
We believe an integrated social component will become a linchpin for emerging consumer companies. And while we’re interested in the forces that have catapulted the current crop of leading social companies to success—we’ll delve into that below—we also recognize that in an increasingly verticalized landscape, not all social companies should be measured by the same yardstick. To that end, this post also provides a framework for rising social apps and explains the relationship between the main app vectors: frequency of use, depth of engagement, and retention.
The inside take on the future of tech.

Understanding social app metrics
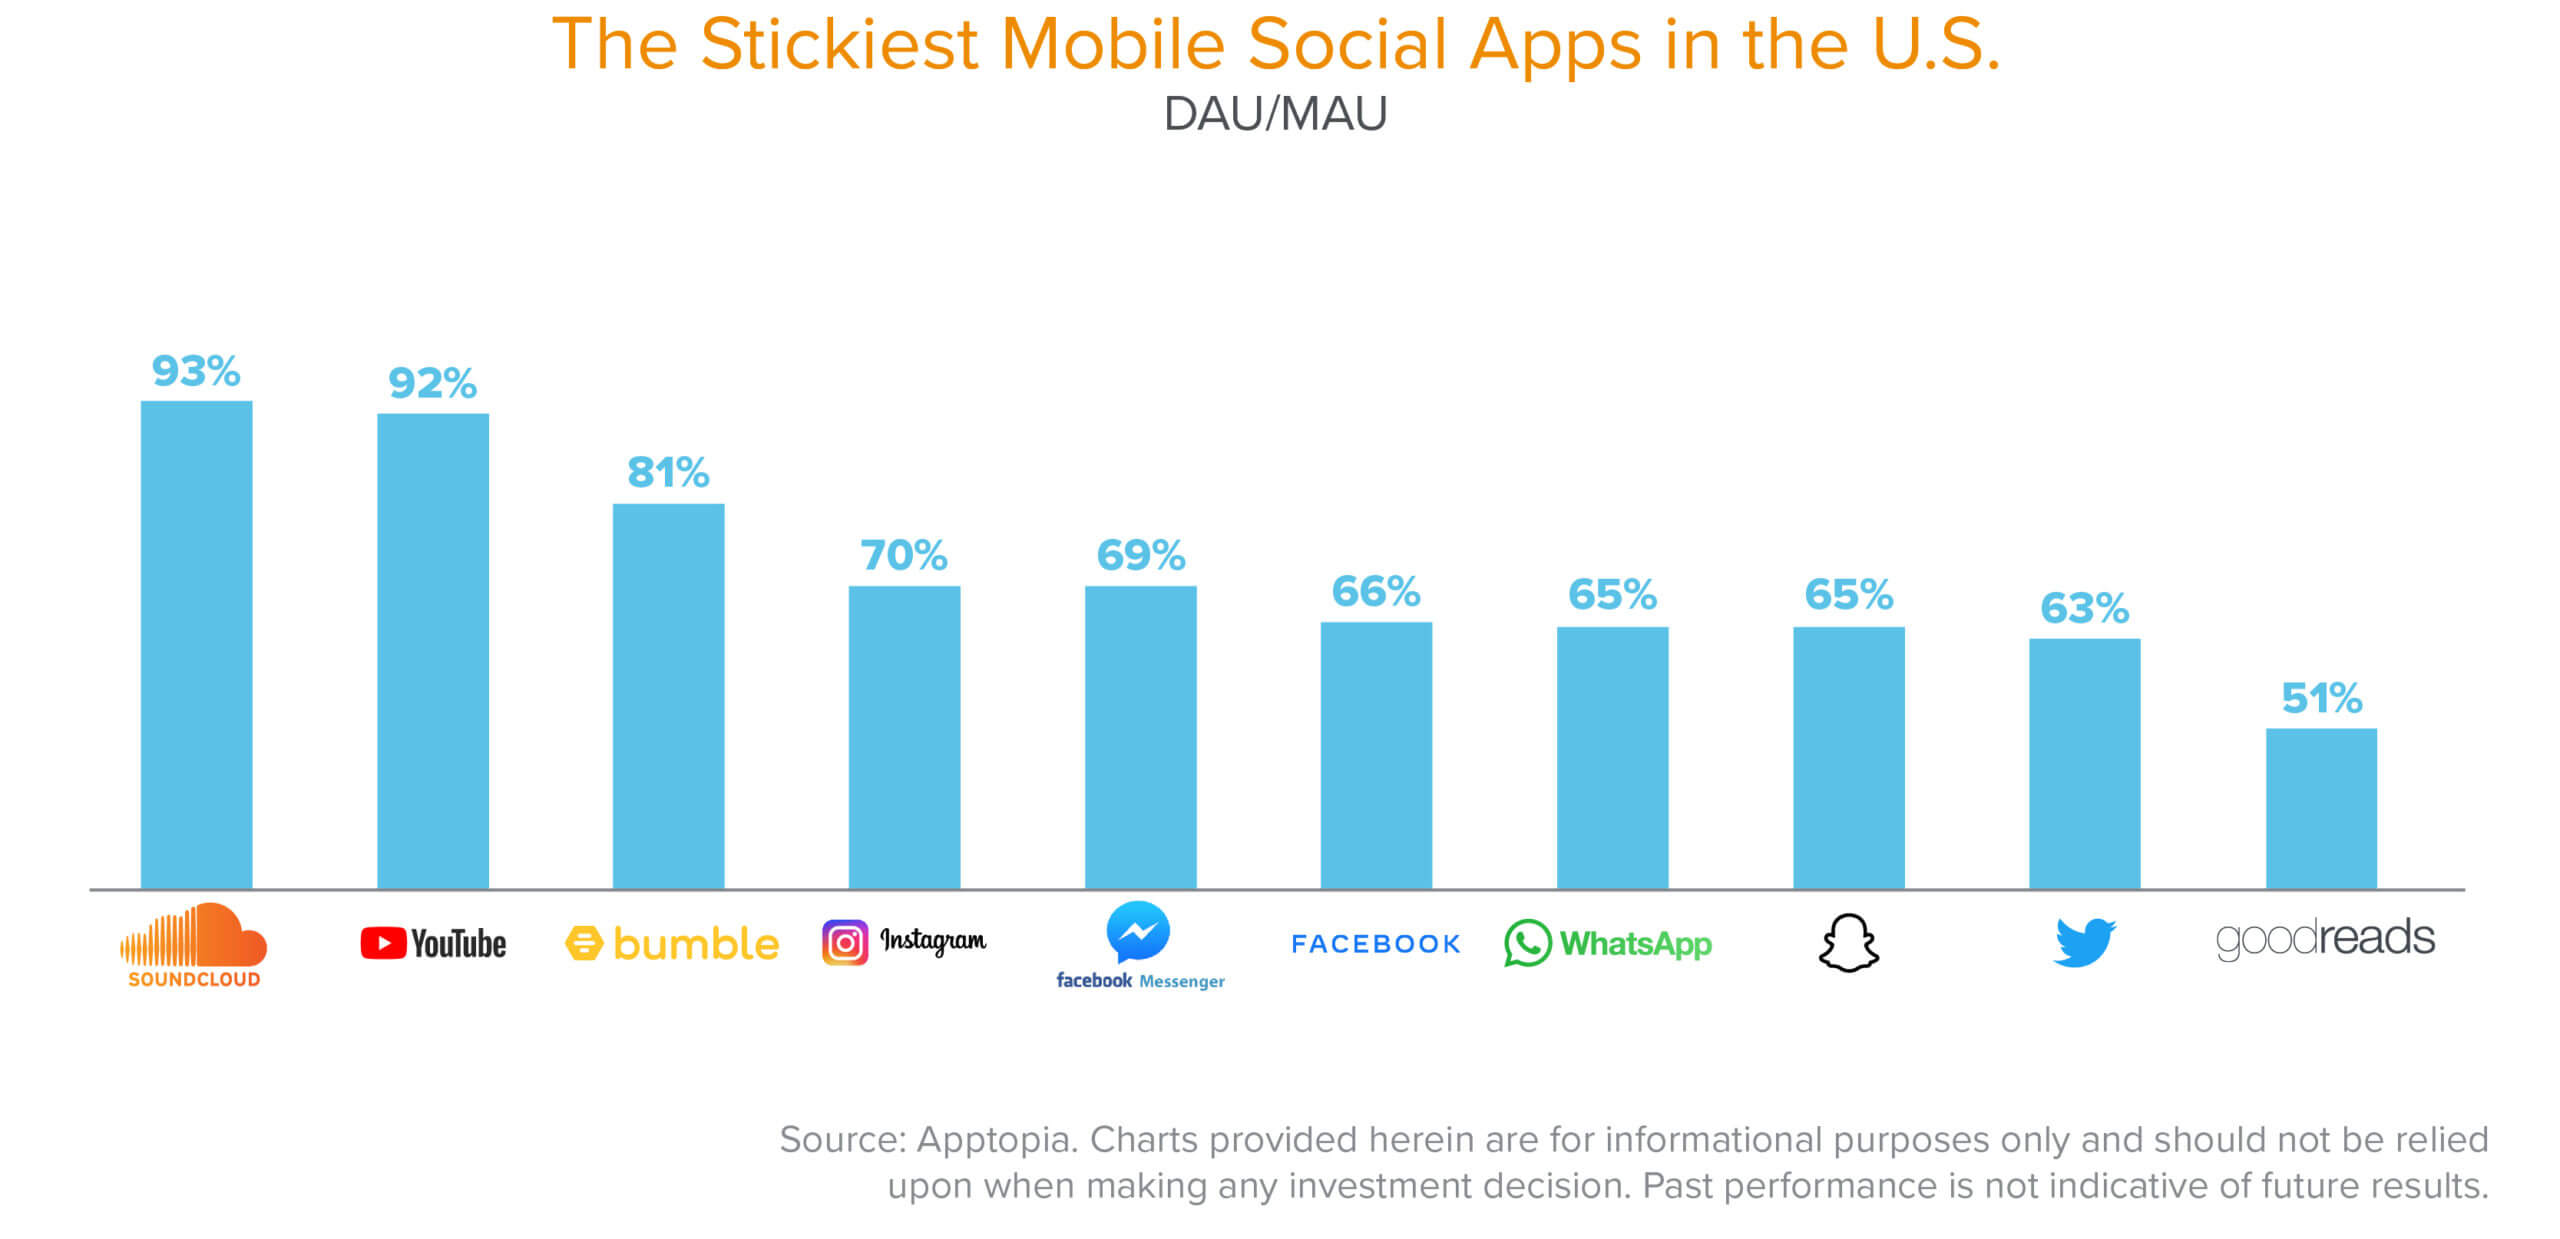
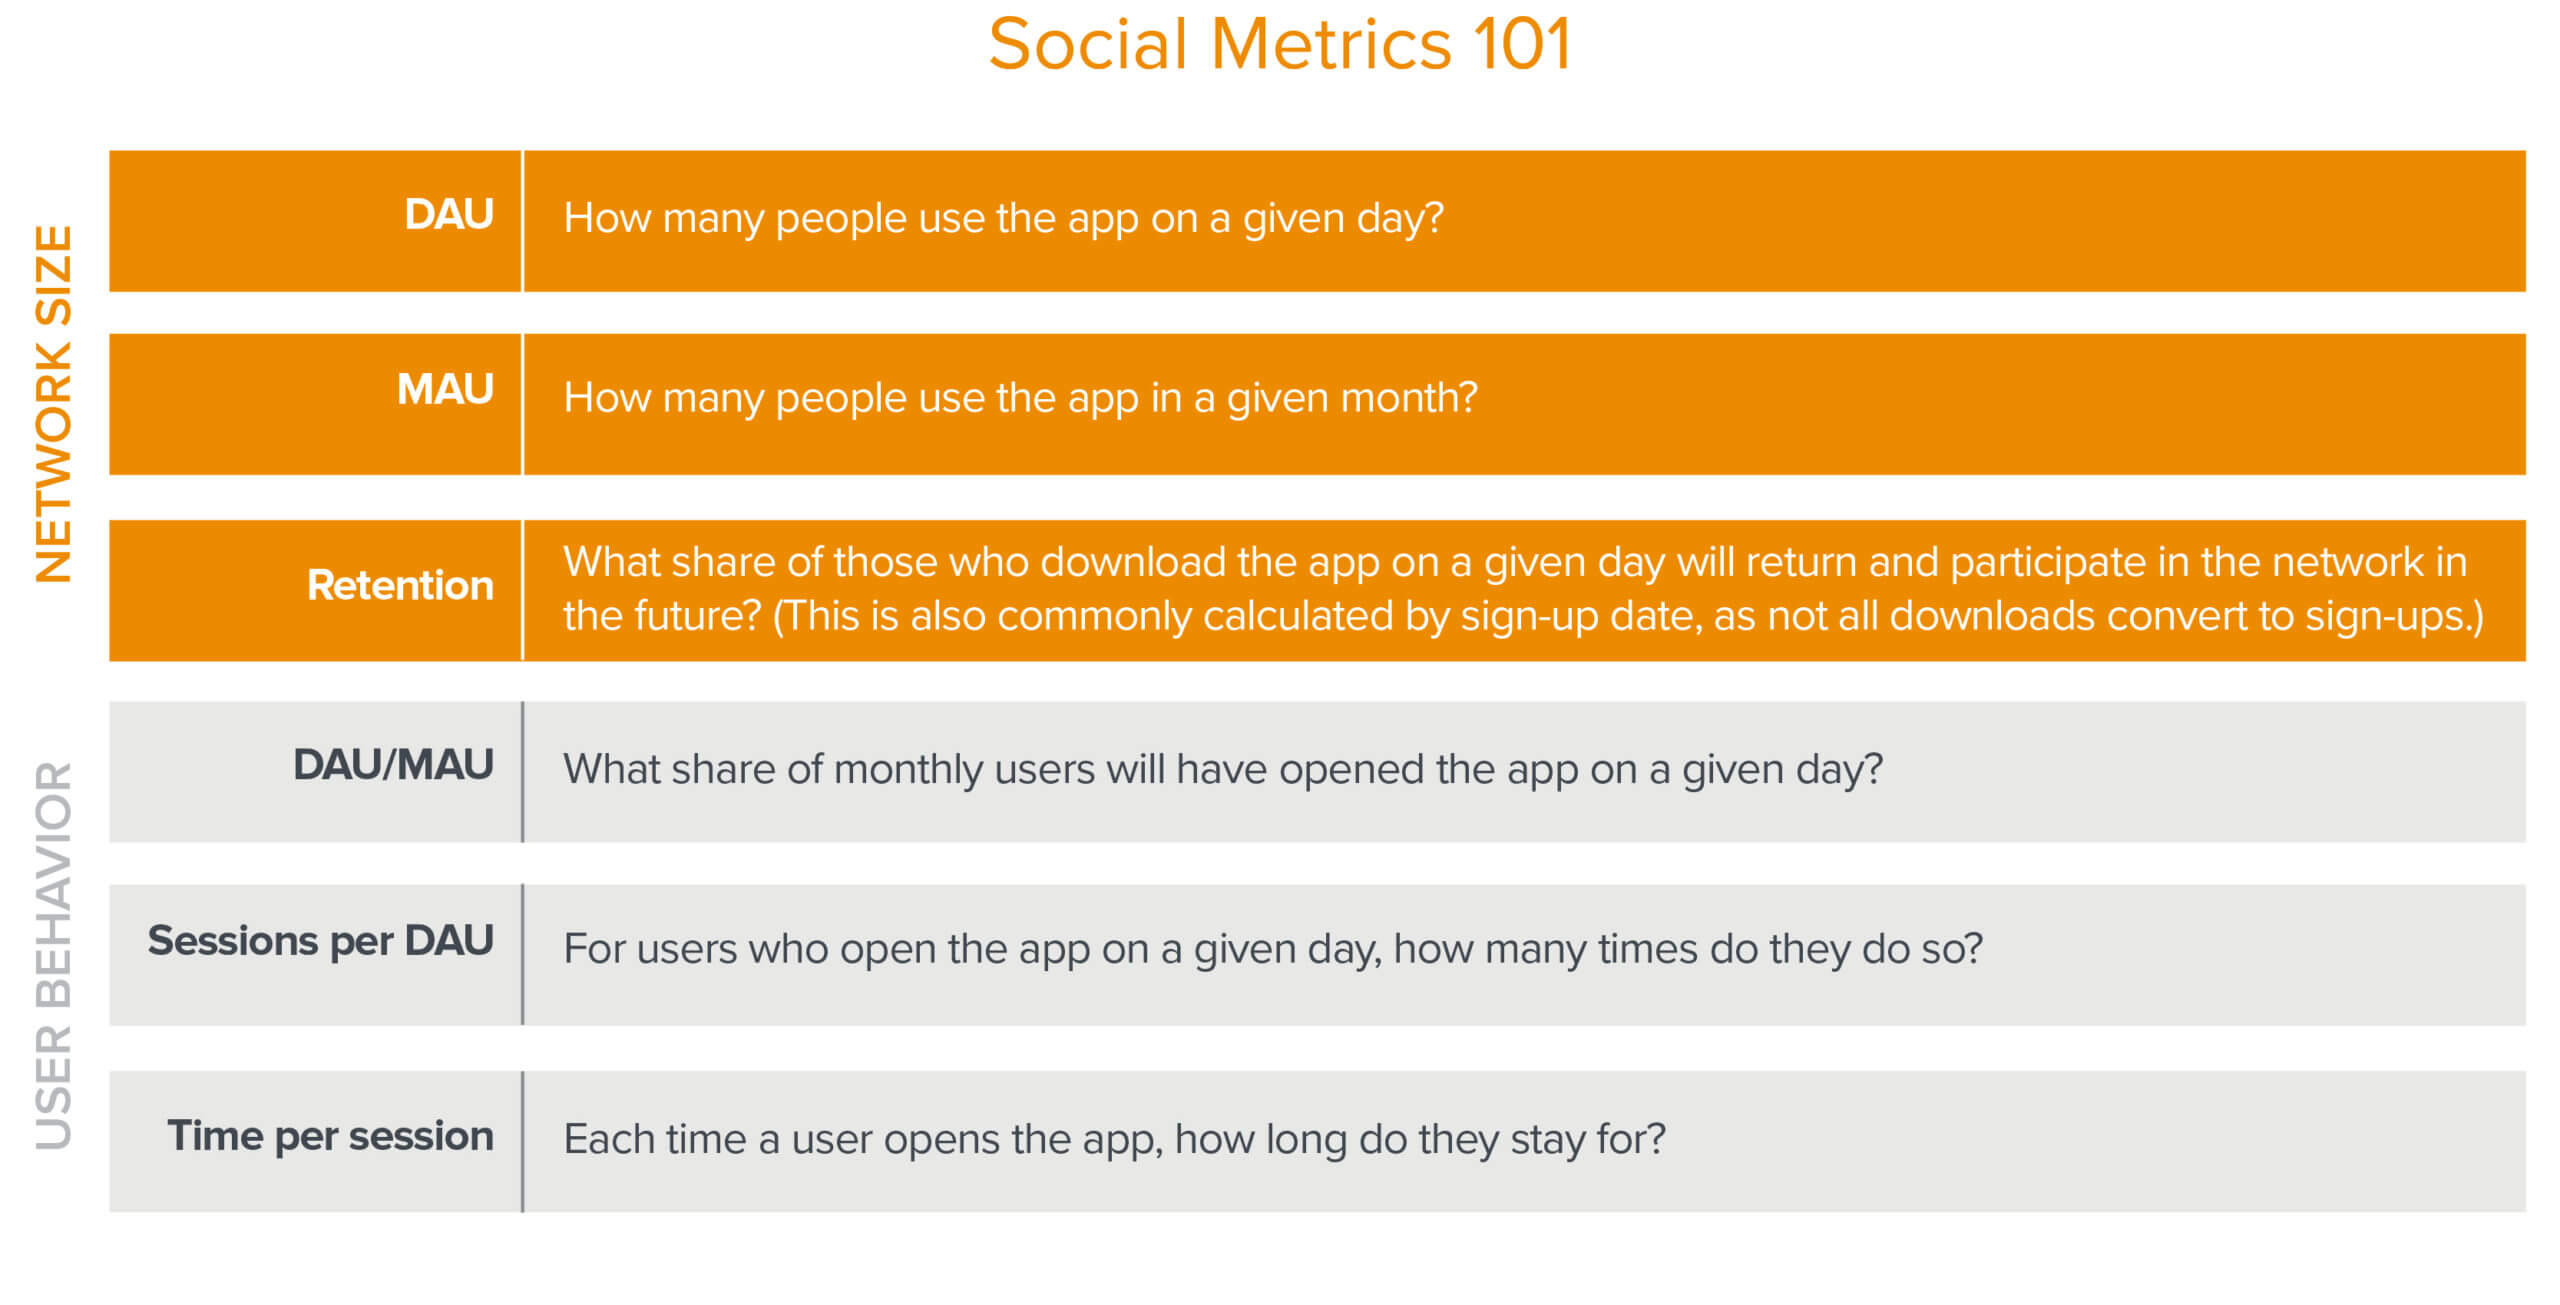
“Social” is a term that’s thrown around liberally these days—and has been co-opted by all manner of brands striving to catch the attention of Gen Z—but for this post, “social” refers to mobile apps that enable peer-to-peer interactions within a definite network of users. In order to evaluate such apps, it’s important to understand some basic metrics. Generally, we first look at Daily Active Users (DAU) and Monthly Active Users (MAU) to measure the scale of a social app’s user network, as well as whether or not it’s growing. DAU/MAU represents the ratio of the two, which indicates a product’s “stickiness.” For example, a DAU/MAU ratio of 33 percent would mean that the average user of said app views it 10 out of 30 days in a month.
At its essence, DAU/MAU is a high-level lens with which to evaluate an app’s network effects: the more frequently users engage with a social network, the more valuable the network becomes to them and, ultimately, the stronger that network grows. DAU/MAU indicates frequency of use; it’s how that ratio evolves over time that signals a working social flywheel.
When network effects kick in, the network begins to fuel itself. Facebook’s portfolio of services, for instance, is the poster child for network effects.
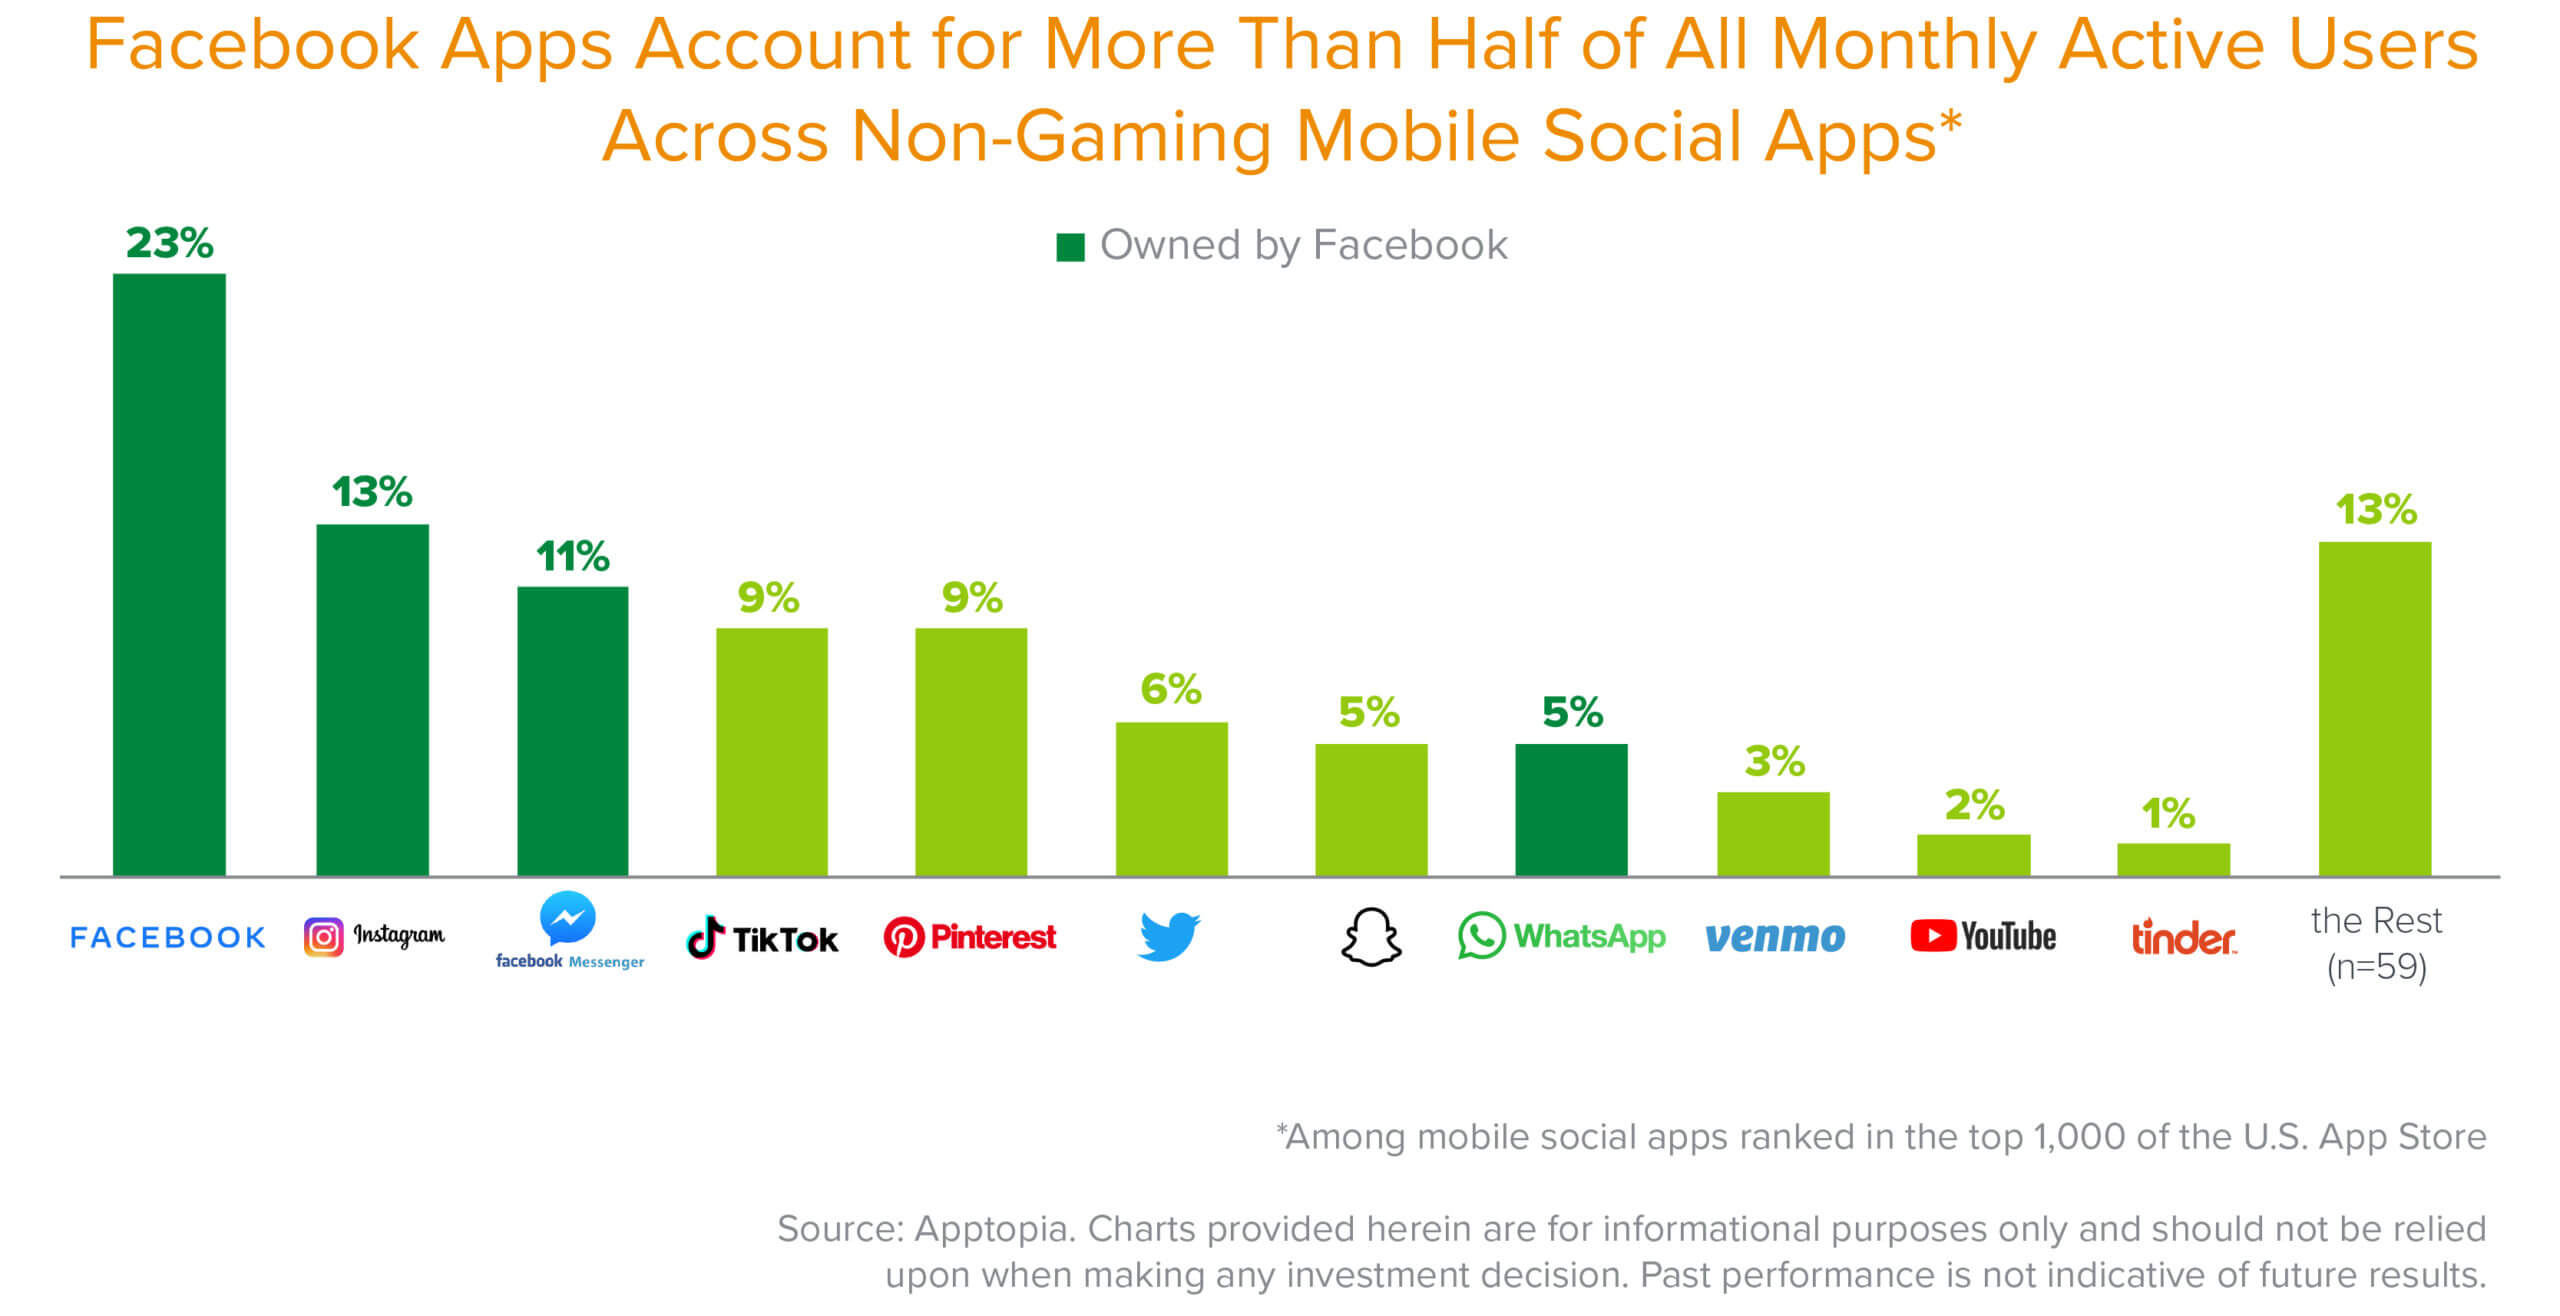
It’s obvious why so many startups want to emulate the Facebook machine: when social apps work, the scale can be huge. Even with just 1 percent share of active users in our analysis, Tinder claims well over 5 million daily active users and brings in over $1 billion in revenue for Match Group each year.
But while it’s a helpful indicator of engagement, DAU/MAU can be a blunt instrument—in most cases, it doesn’t tell the whole story. For social apps in particular, DAU/MAU is an extension of the highest-frequency use case, which is often circumstantial. Those who download the SoundCloud mobile app or the YouTube mobile app, for instance, are likely to listen to a lot of music or watch a lot of videos, compared to users who typically check out YouTube or SoundCloud on the web. For this reason, in social, DAU/MAU levels are often highest around media consumption: listening to music, watching videos, playing games, or scrolling social media.
Similarly, engagement in dating apps tends to be skewed around a core of super-users. Not everyone is looking for love, but those who are—and who follow through with downloading an app like Bumble—are highly active on the app.
As every type of social app is different, so is its frequency of use. You may be more likely to tap the Instagram icon every day (ahem, even multiple times a day) than, say, Venmo, but users of both those apps are equally likely to return to them 30 days from the download date.
Beyond DAU/MAU, there are more nuanced ways to analyze social apps that take into consideration the type of app and its core user behavior. It’s important to understand how these metrics relate to each other, rather than applying one standard across the entire spectrum of social apps.
 Addiction + absorption: A framework for time spent on social apps
When it comes to the stickiness of social apps, what does “great” look like? Beyond knowing whether or not a user checked out your app, it’s useful to have a pulse on the depth of engagement—that is, how much time users spend in the app.
In assessing the data, we recognized an interesting distinction: addiction vs. absorption. Below, we examined the most “addictive” apps (measured by the number of times active users open the app per day, e.g. sessions per DAU) and the most “engrossing” apps (the average number of minutes active users spend in the app per session).
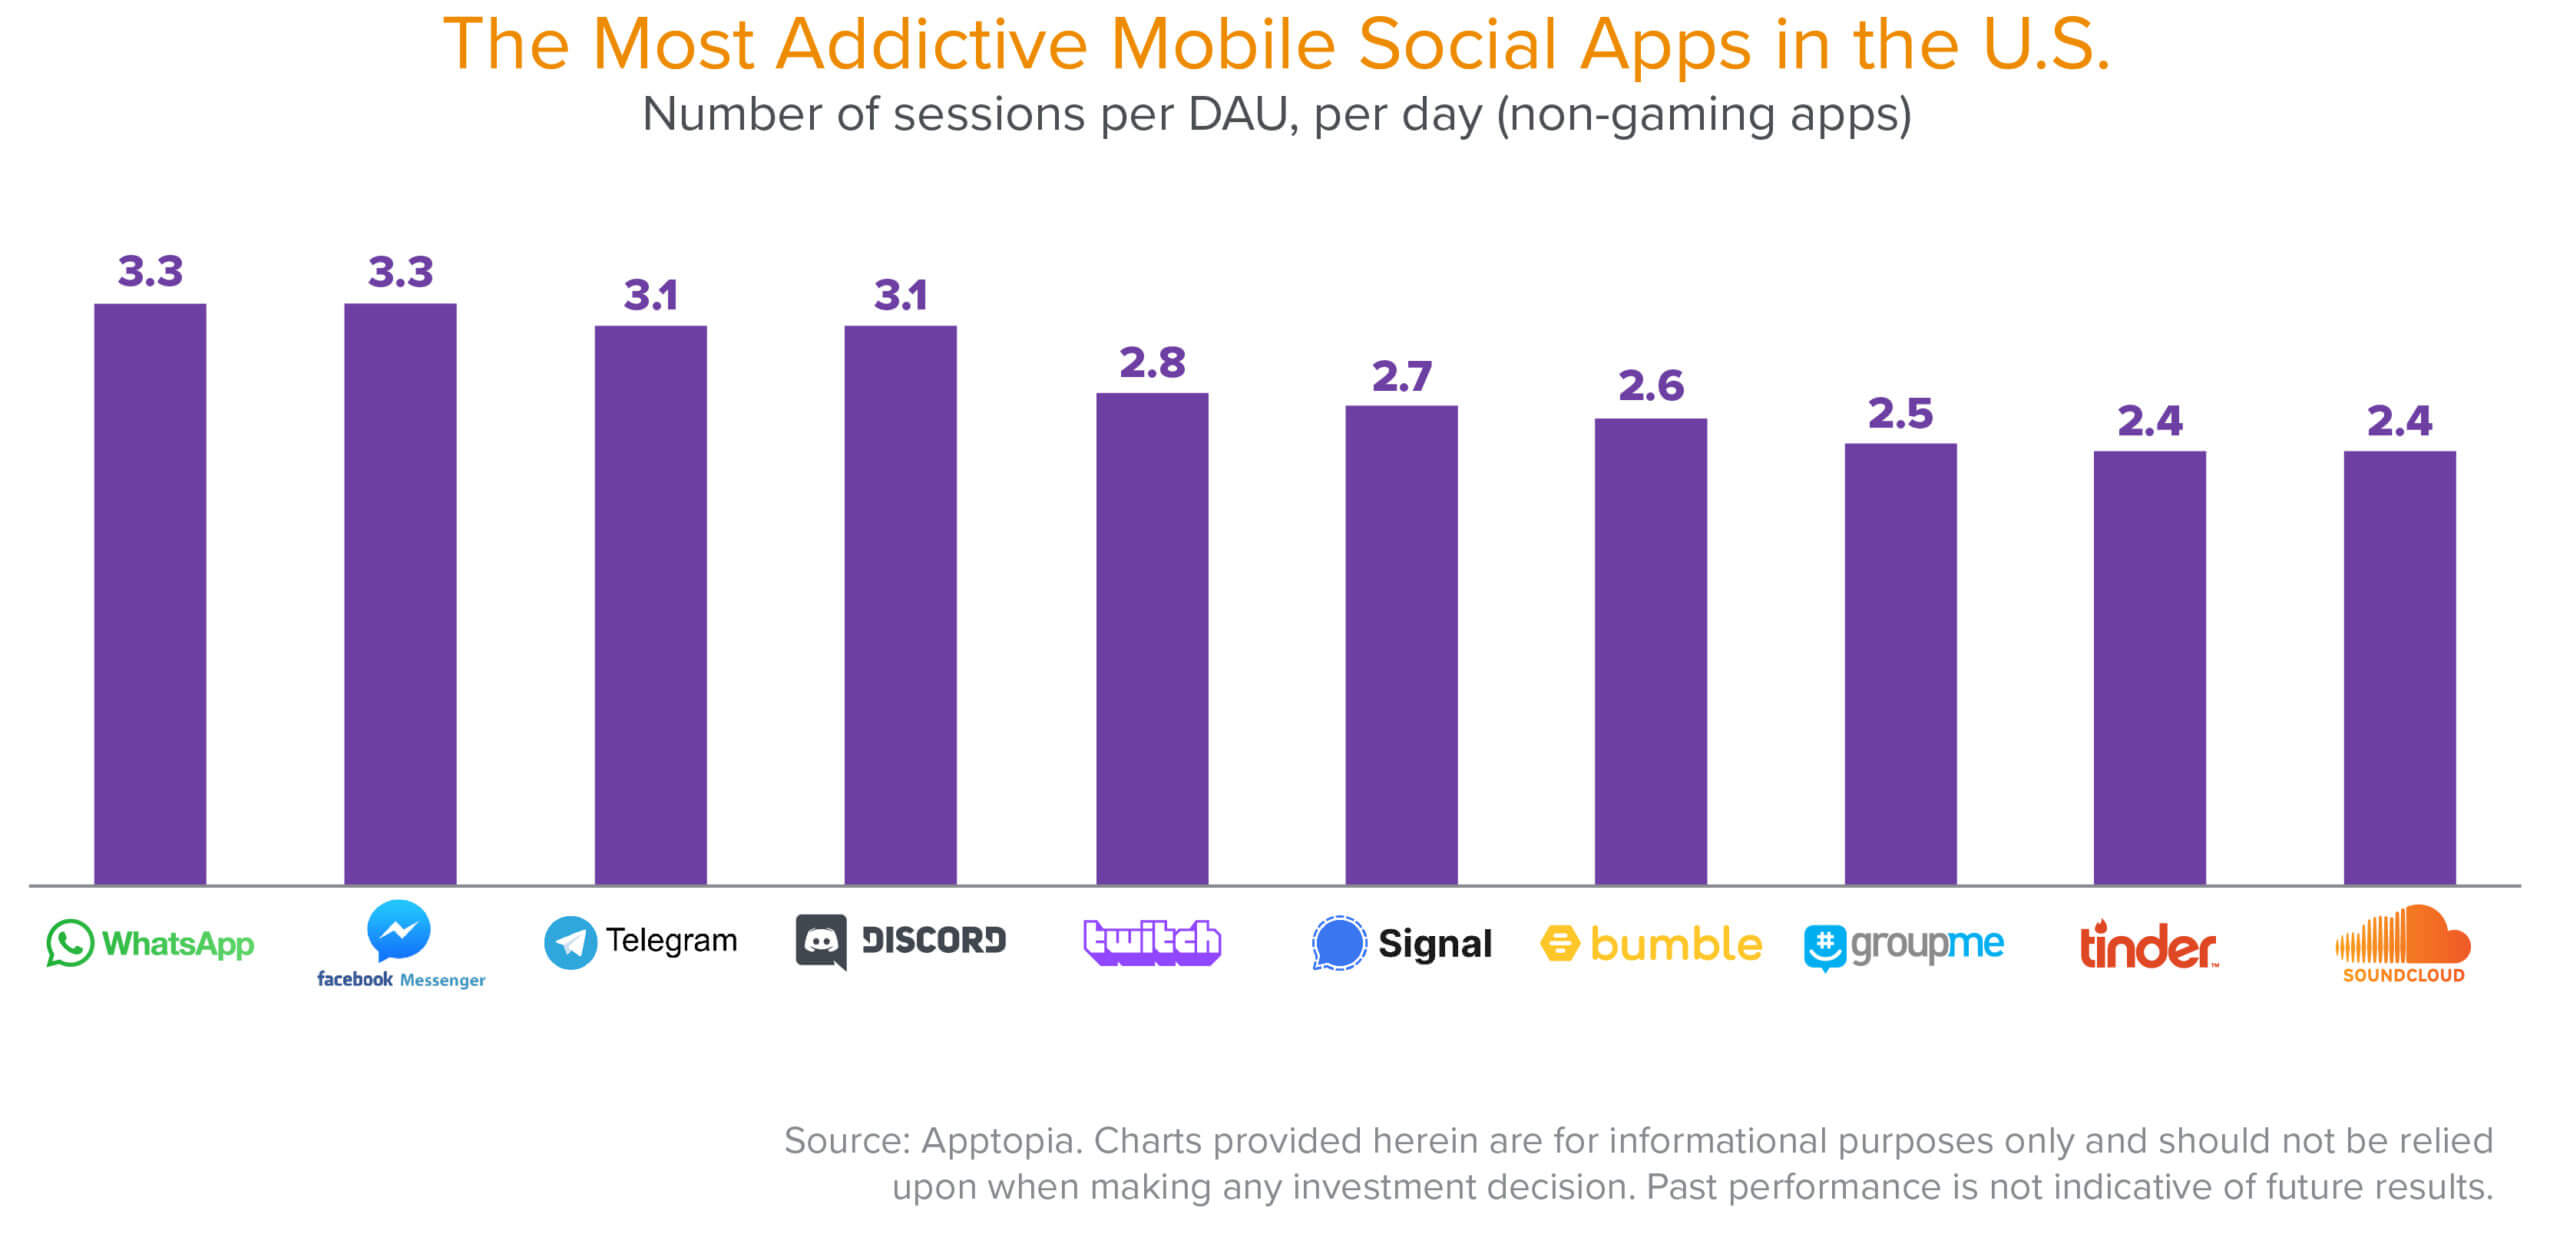
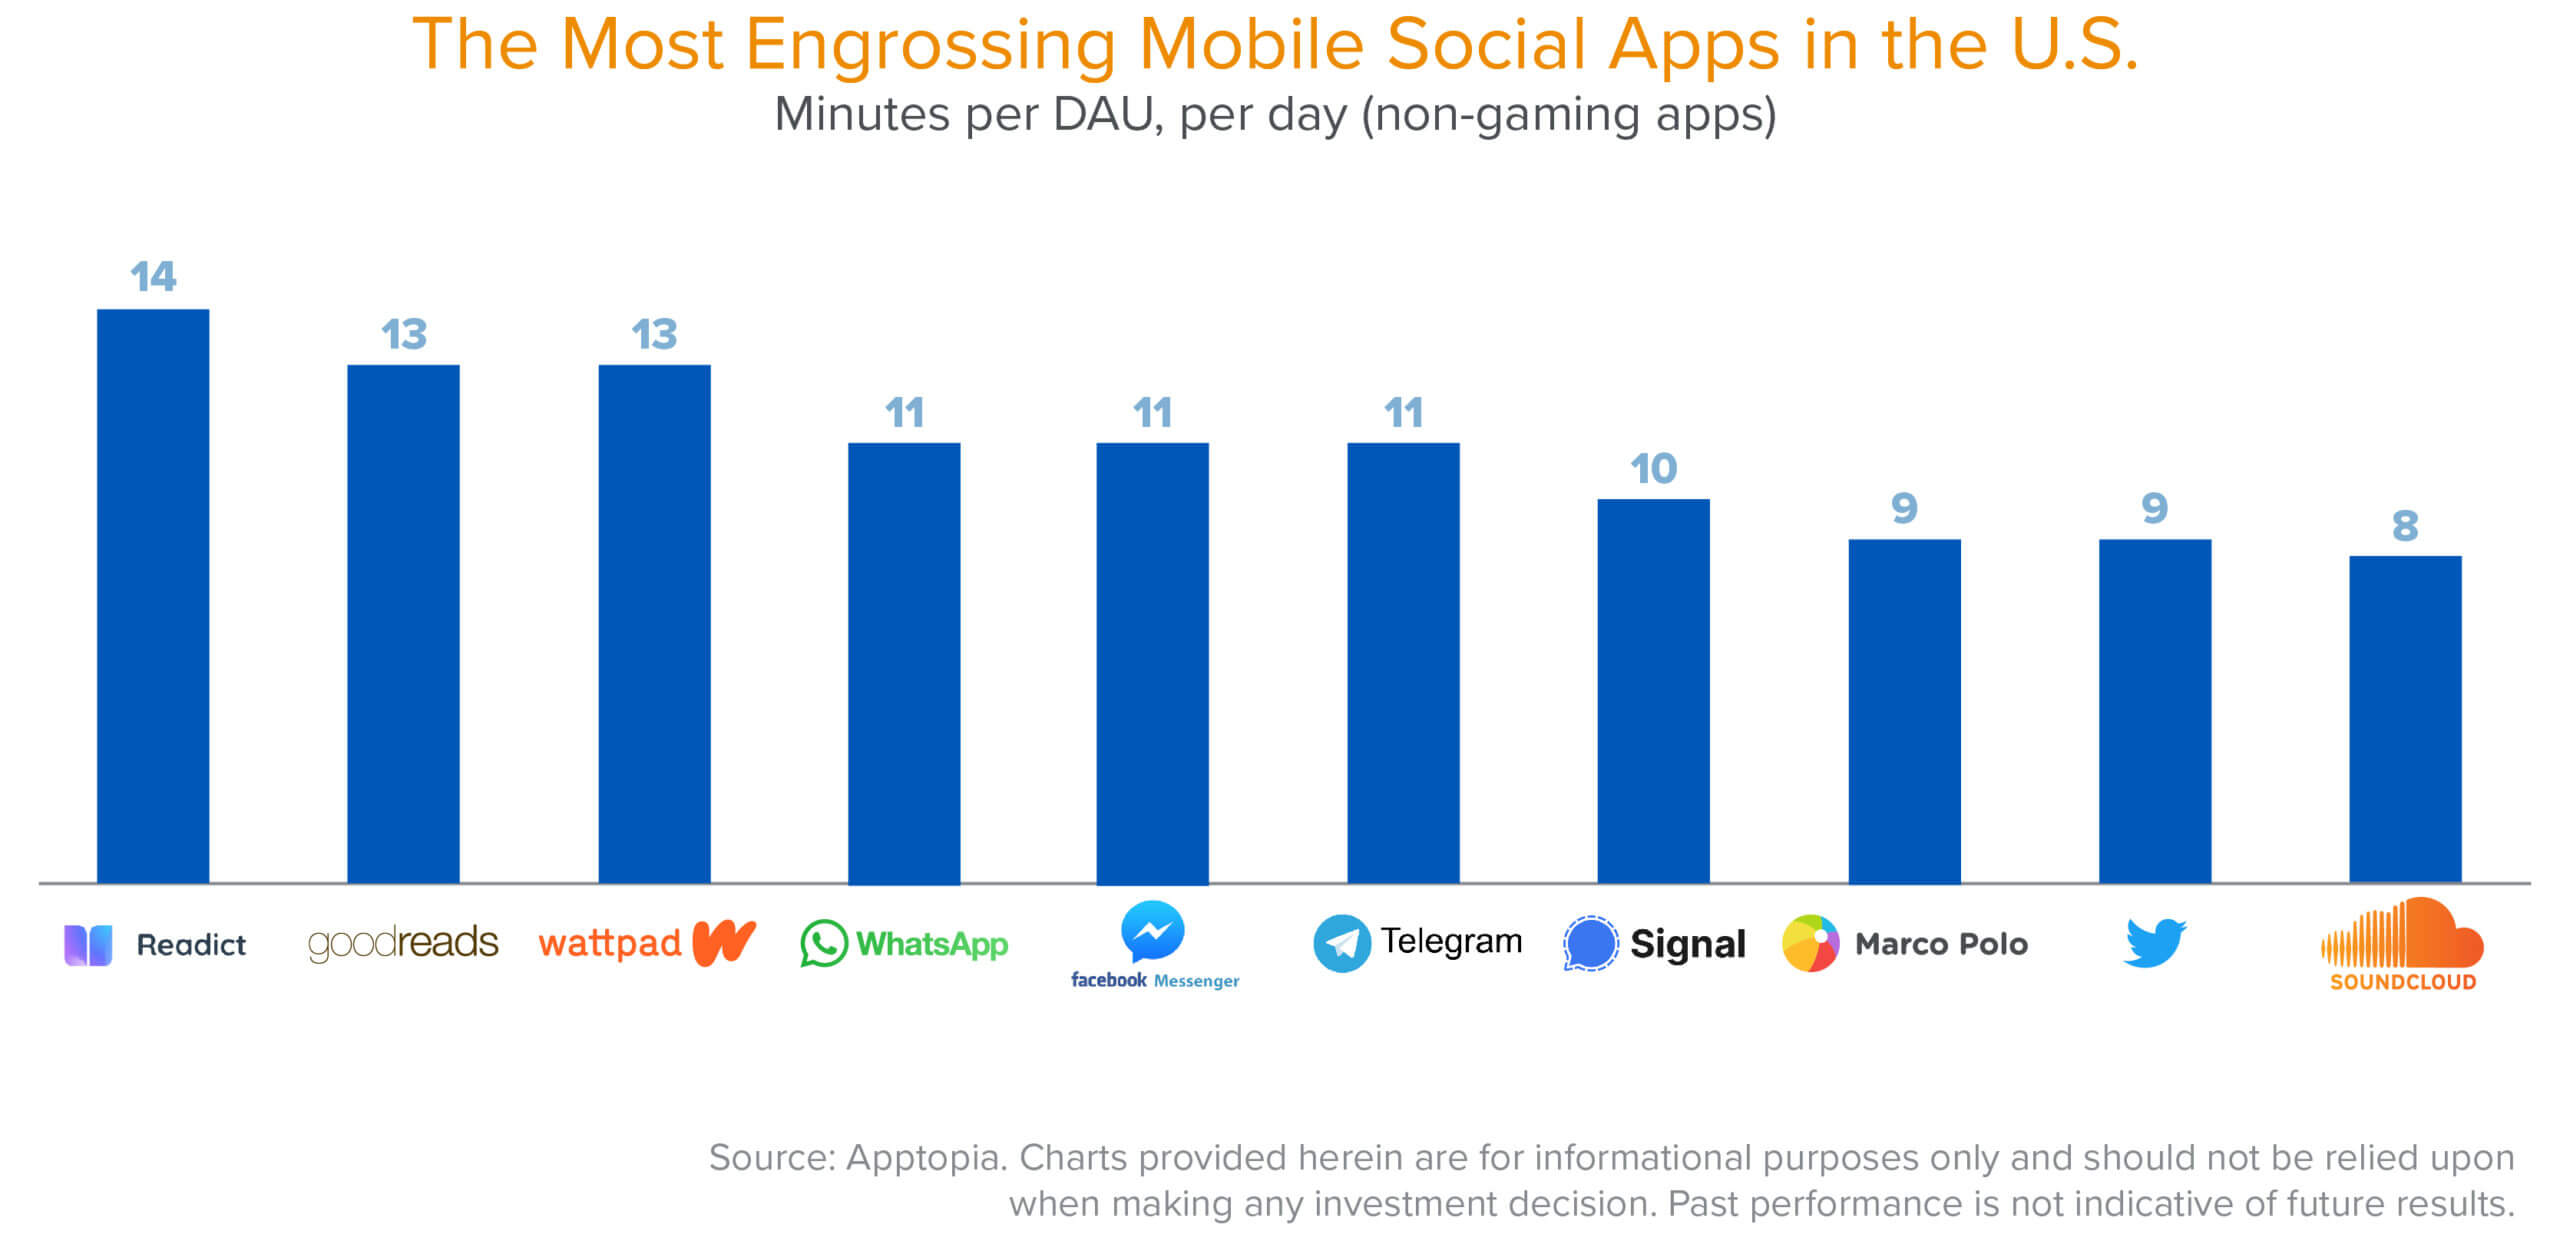
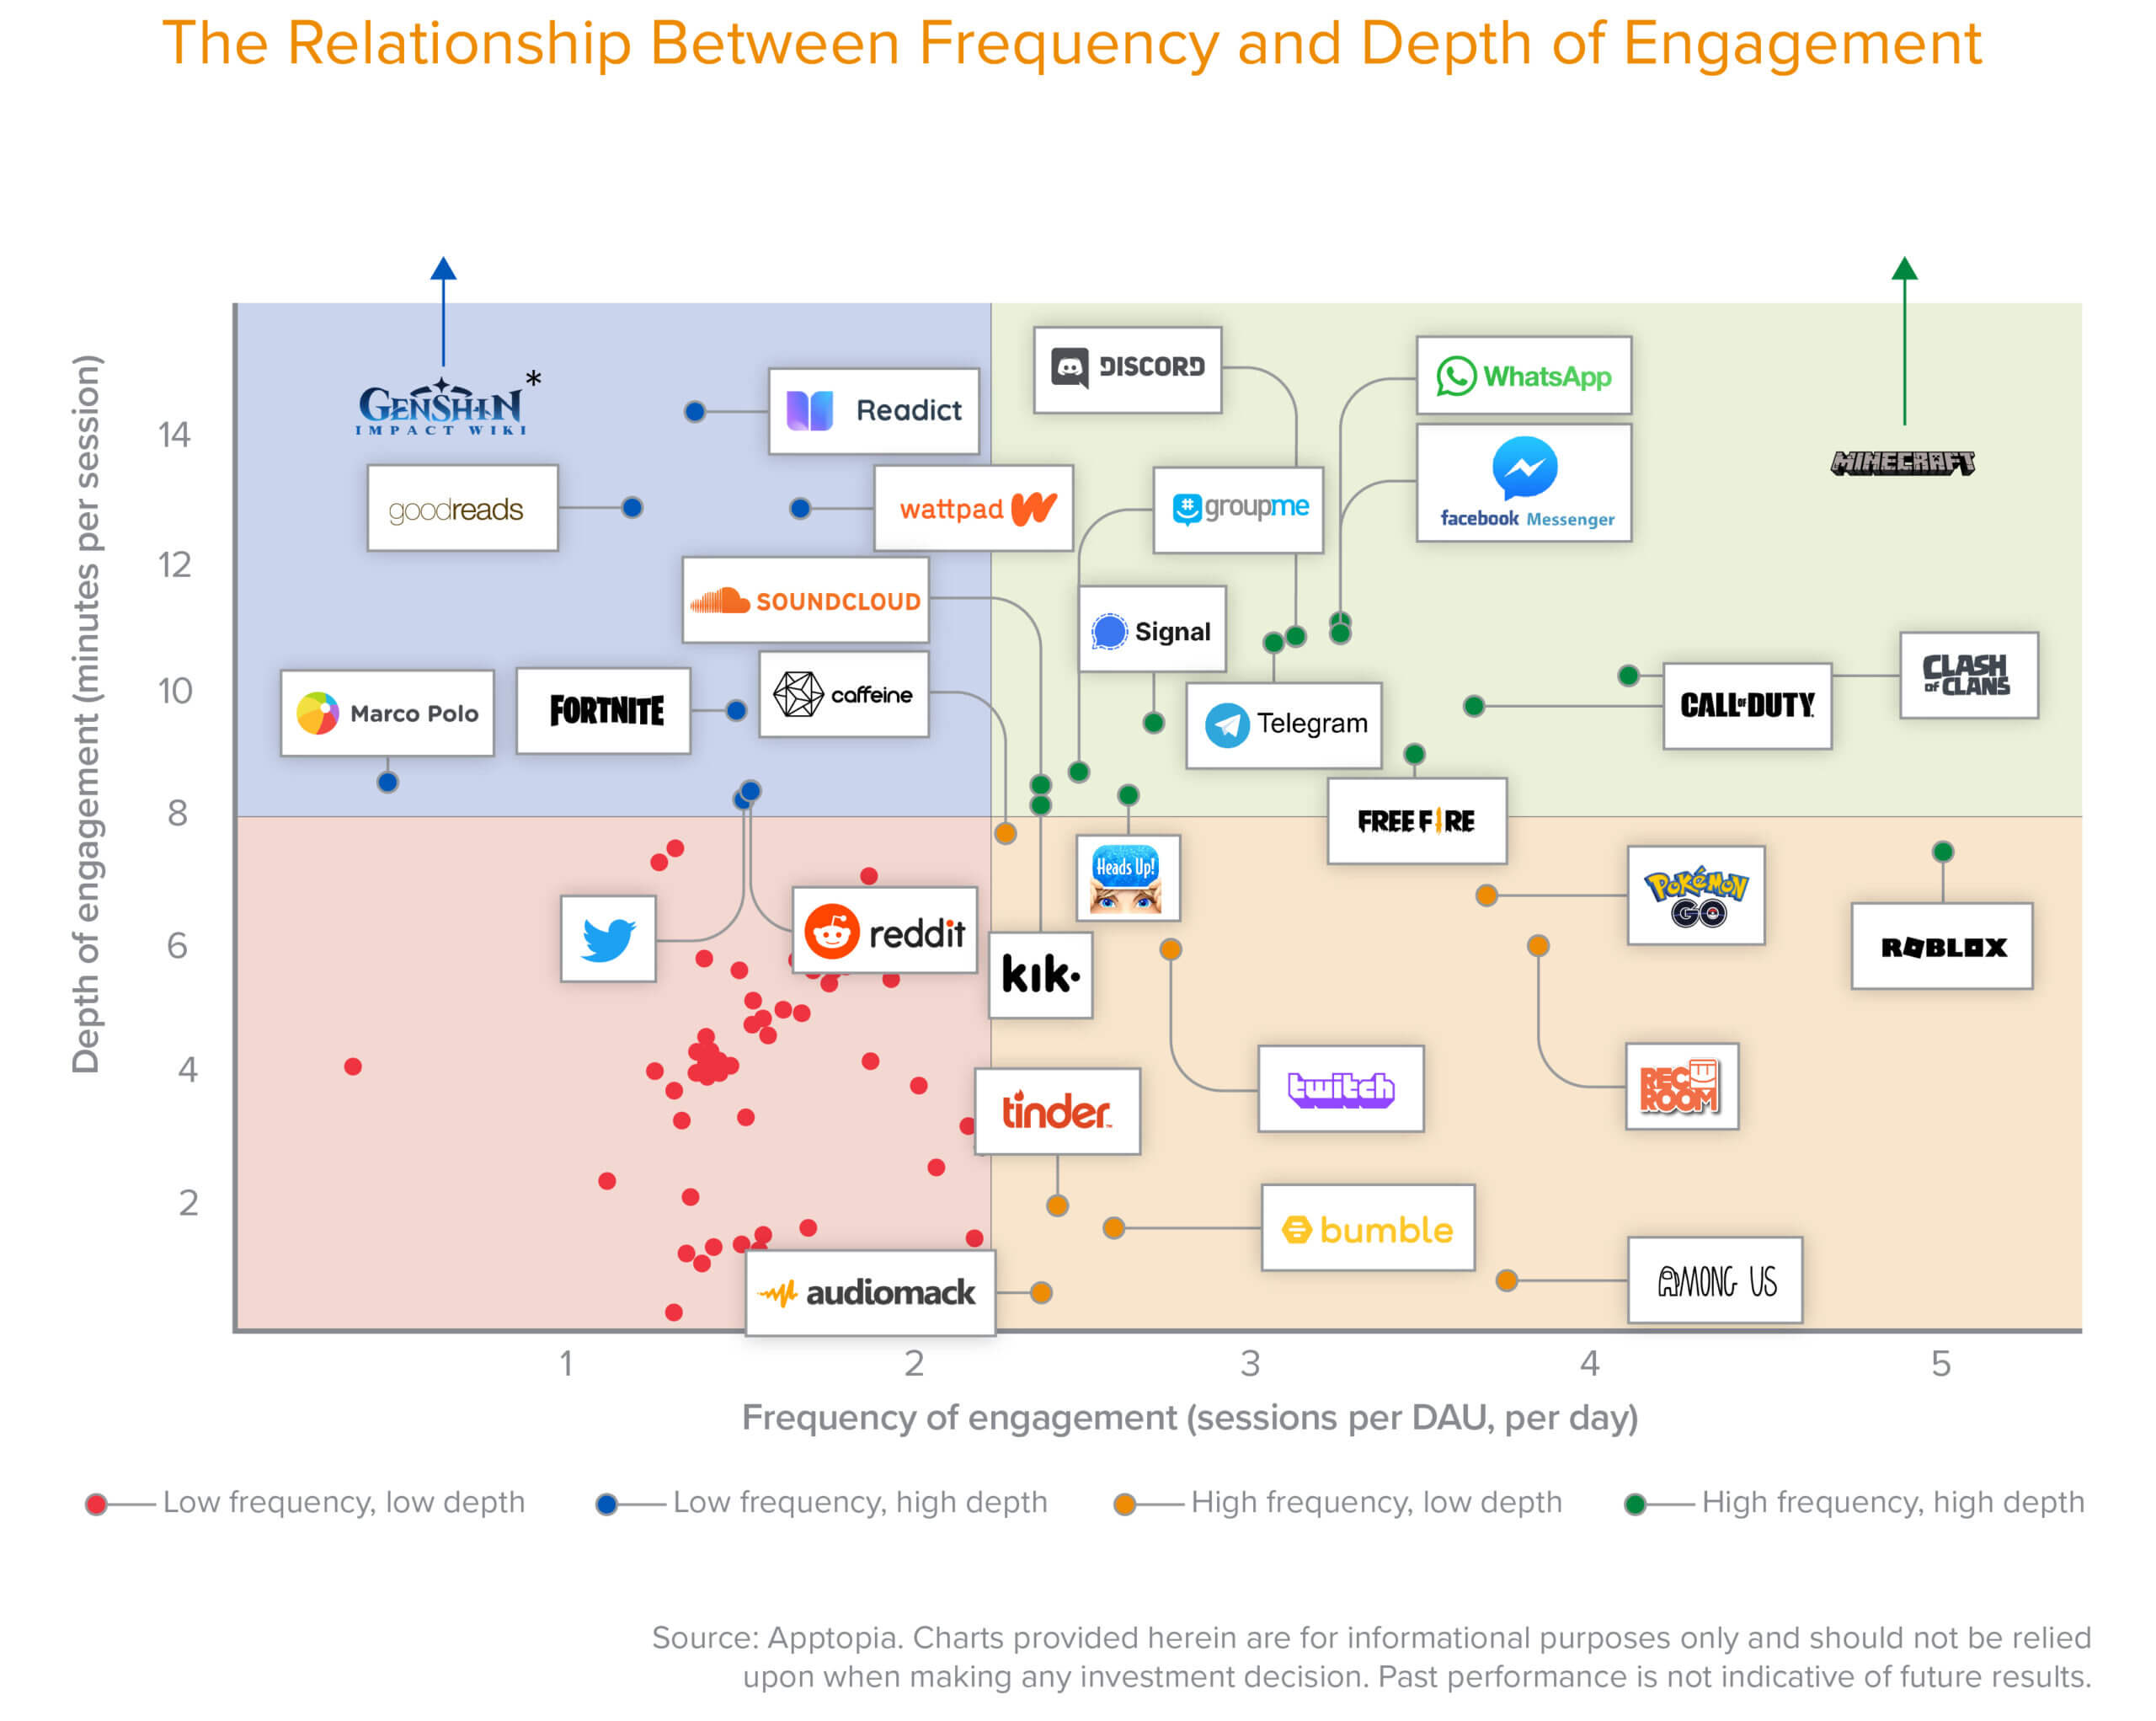
It’s evident that depth of engagement does not necessarily equate to stickiness. Similarly, not every app has to be used on a daily basis to be valuable. Some apps thrive on hyper-active use, but the depth of each engagement is limited. That dynamic can be seen on dating apps like Bumble and Tinder. On average, users check their dating apps relatively often, 2.5 times per day, but each session only lasts one to two minutes. By comparison, vertical communities for reading and writing like Goodreads, Wattpad, and Readict are visited less frequently—one to two times per day—but command more than 13 minutes per session, on average. Despite the relative lack of frequent visits, these users continue to spend a considerable amount of time in the app, indicating they extract meaningful value from the network.
Both models can be successful. The key metric is the aggregate:
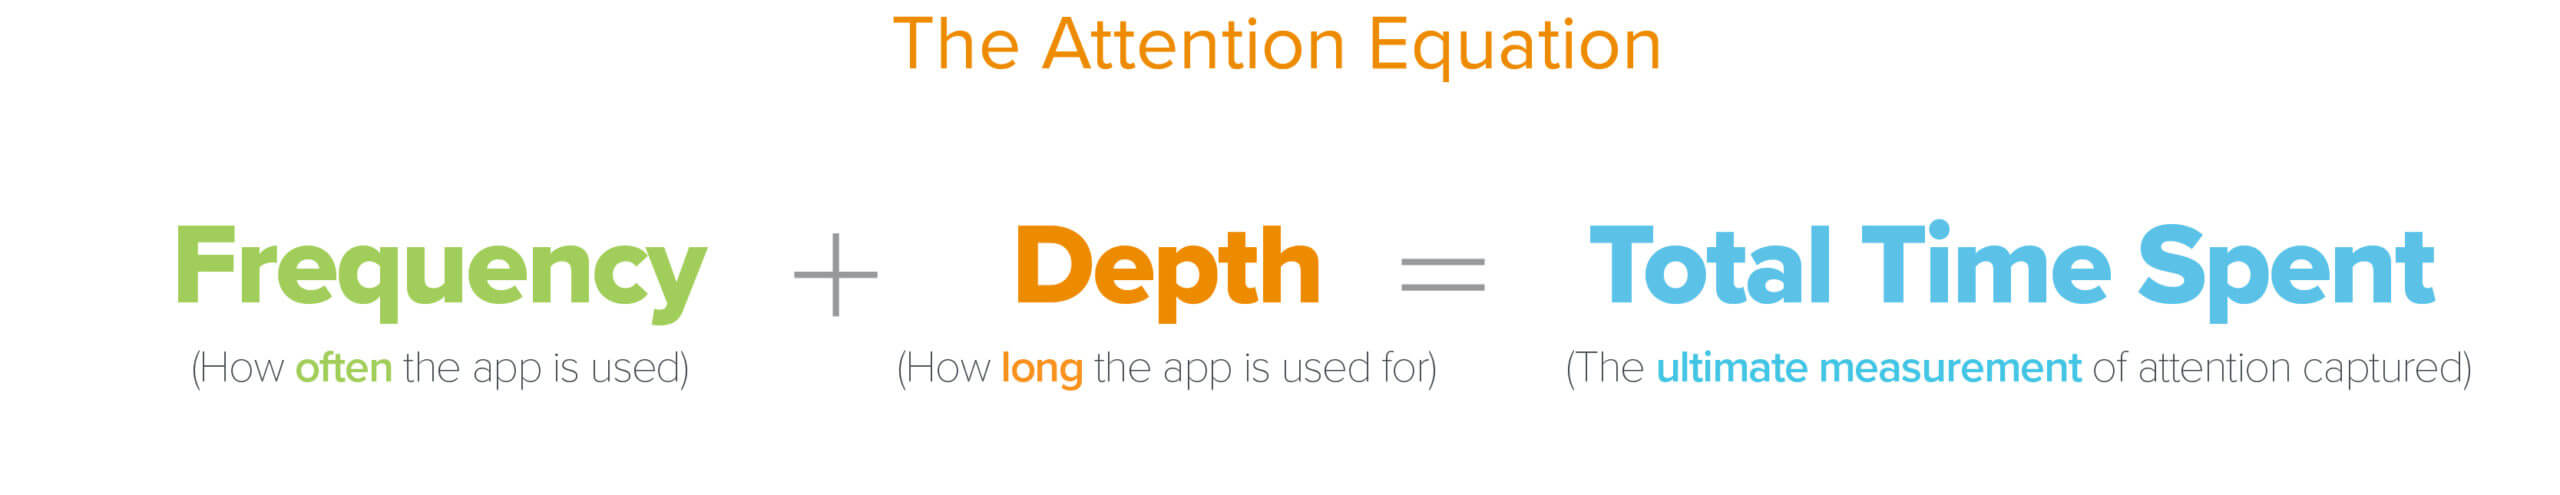
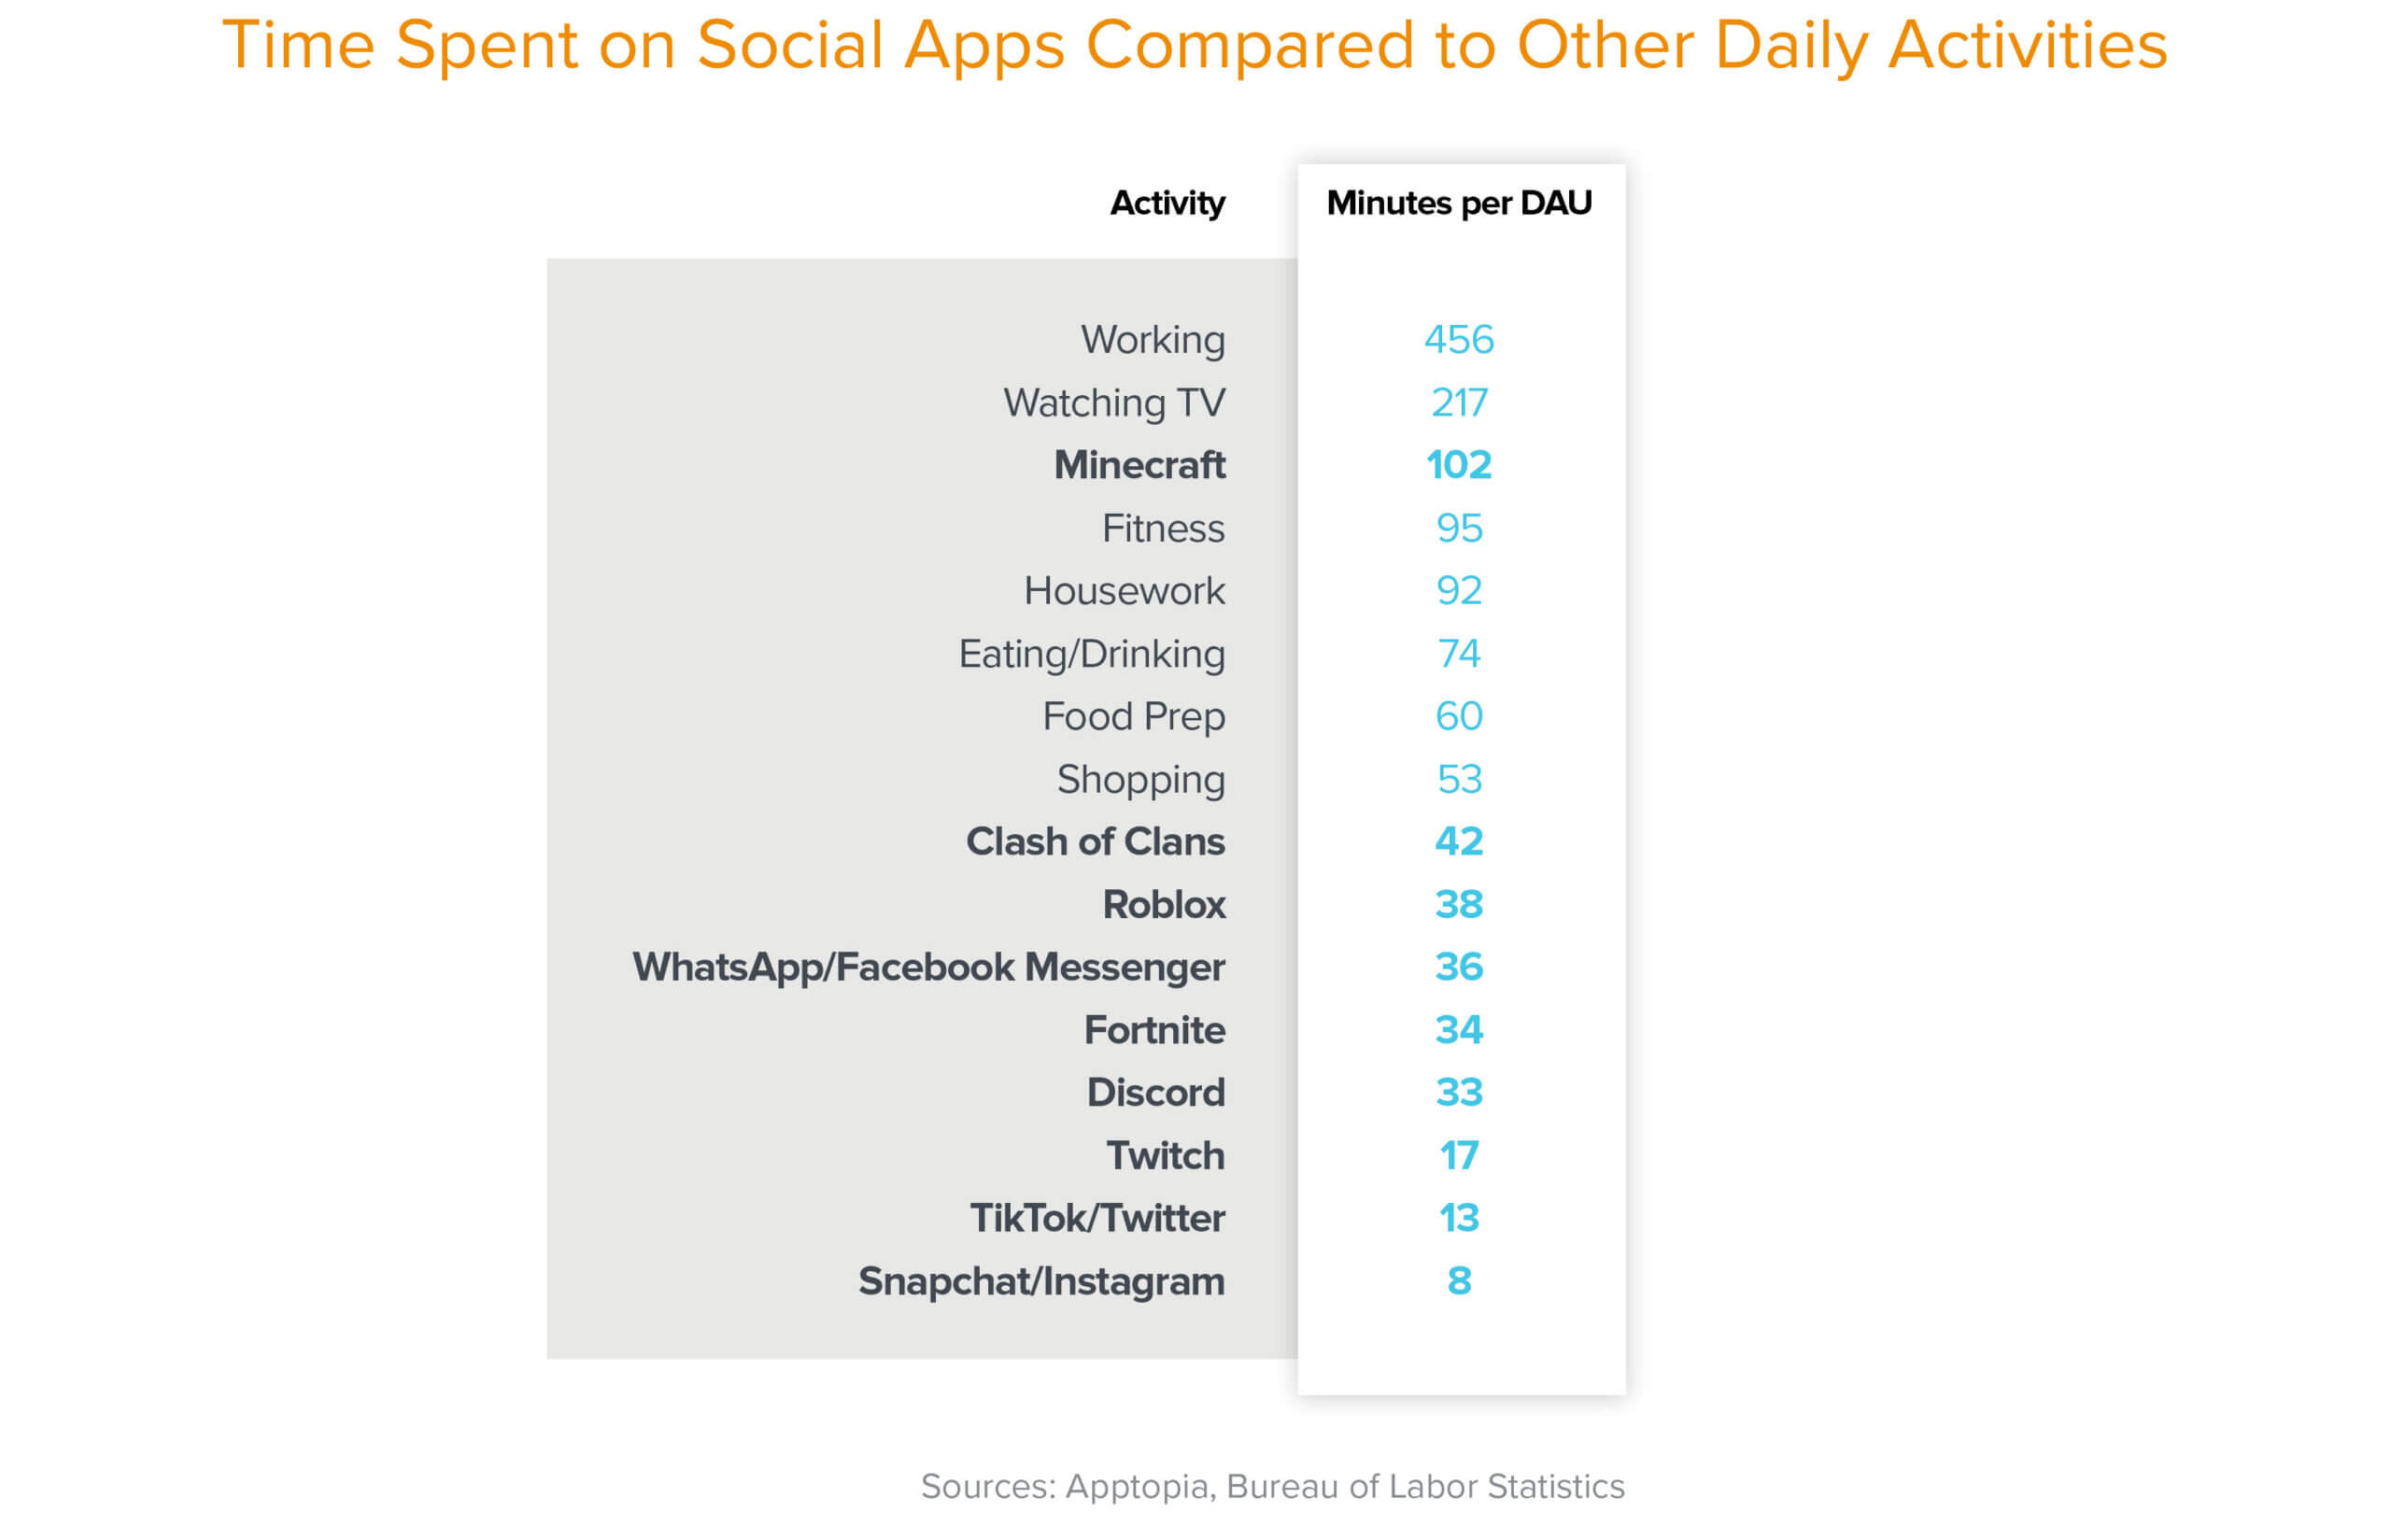
Of course, some social apps are both addictive and engrossing. Across the set of top social apps, social games and messaging apps are visited most frequently and engage users for the longest amount of time per visit, across the board. By way of comparison, check out how several top social apps compare to other daily activities in terms of minutes per DAU (of those who partake in an activity, how many minutes they spend doing it per day).
In this context, we consider total time spent per user to be a proxy for how much value users are extracting from the respective app’s network. The attention captured metric is the answer to the age-old question, “Is this worth my time?” Of course, not all time spent in apps is equally valuable, from a business standpoint. Consuming TikTok videos for an hour is a dramatically more monetizable behavior than corresponding with friends on Facebook Messenger all day. Whereas in-platform ads are unlikely to faze TikTok users, where content is engaging and exclusive, they’re more likely to mar the experience or repel users on messaging apps, of which there are many free competitors. Nonetheless, attention captured is an indicator for the network’s monetization potential, whether the business model is based in ads, ecommerce, microtransactions, or otherwise.
Understanding benchmarks by category
While it’s important to understand what “winning” social metrics look like from a macro perspective, every app’s benchmarks are specific to its respective category. Tinder’s engagement levels should be compared to Bumble and other dating apps, not Facebook or TikTok. Though all these apps may be “social,” the underlying use cases and corresponding behaviors are fundamentally different for different categories. (In addition, it’s important to note that many of those consumer behaviors have been acutely impacted by the pandemic, which has accelerated the growth of many of the apps below—particularly in the professional category.)
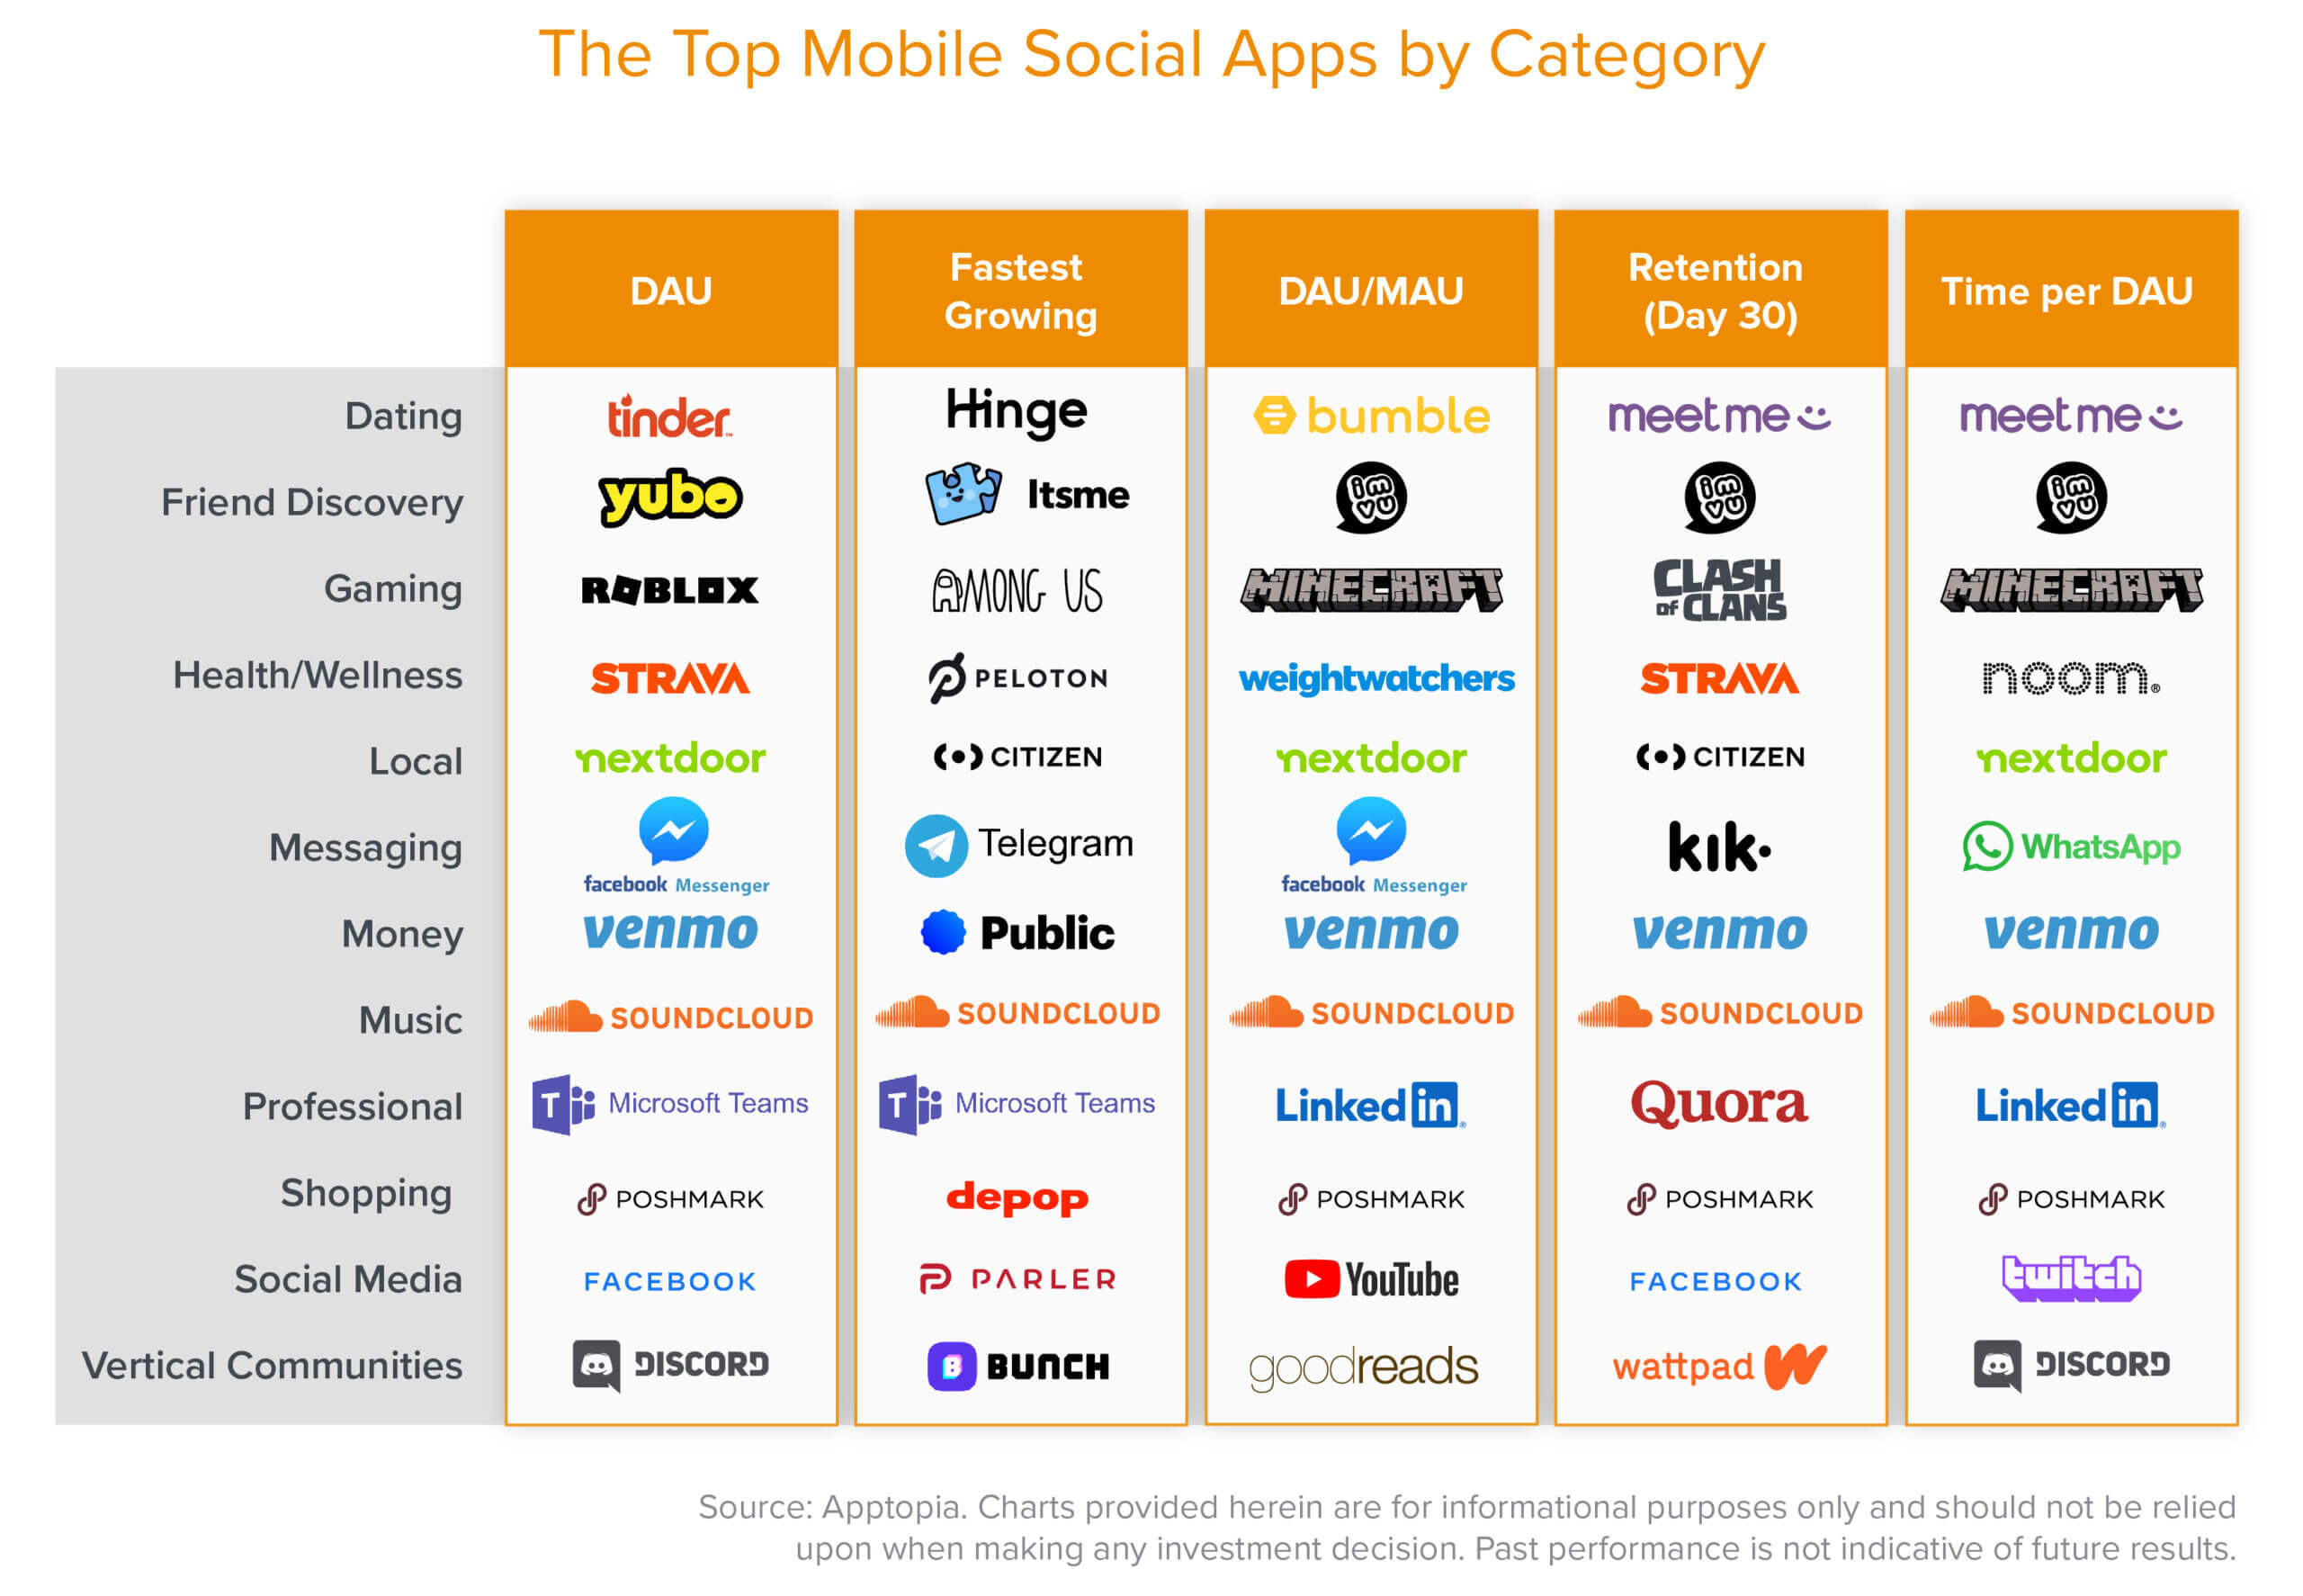
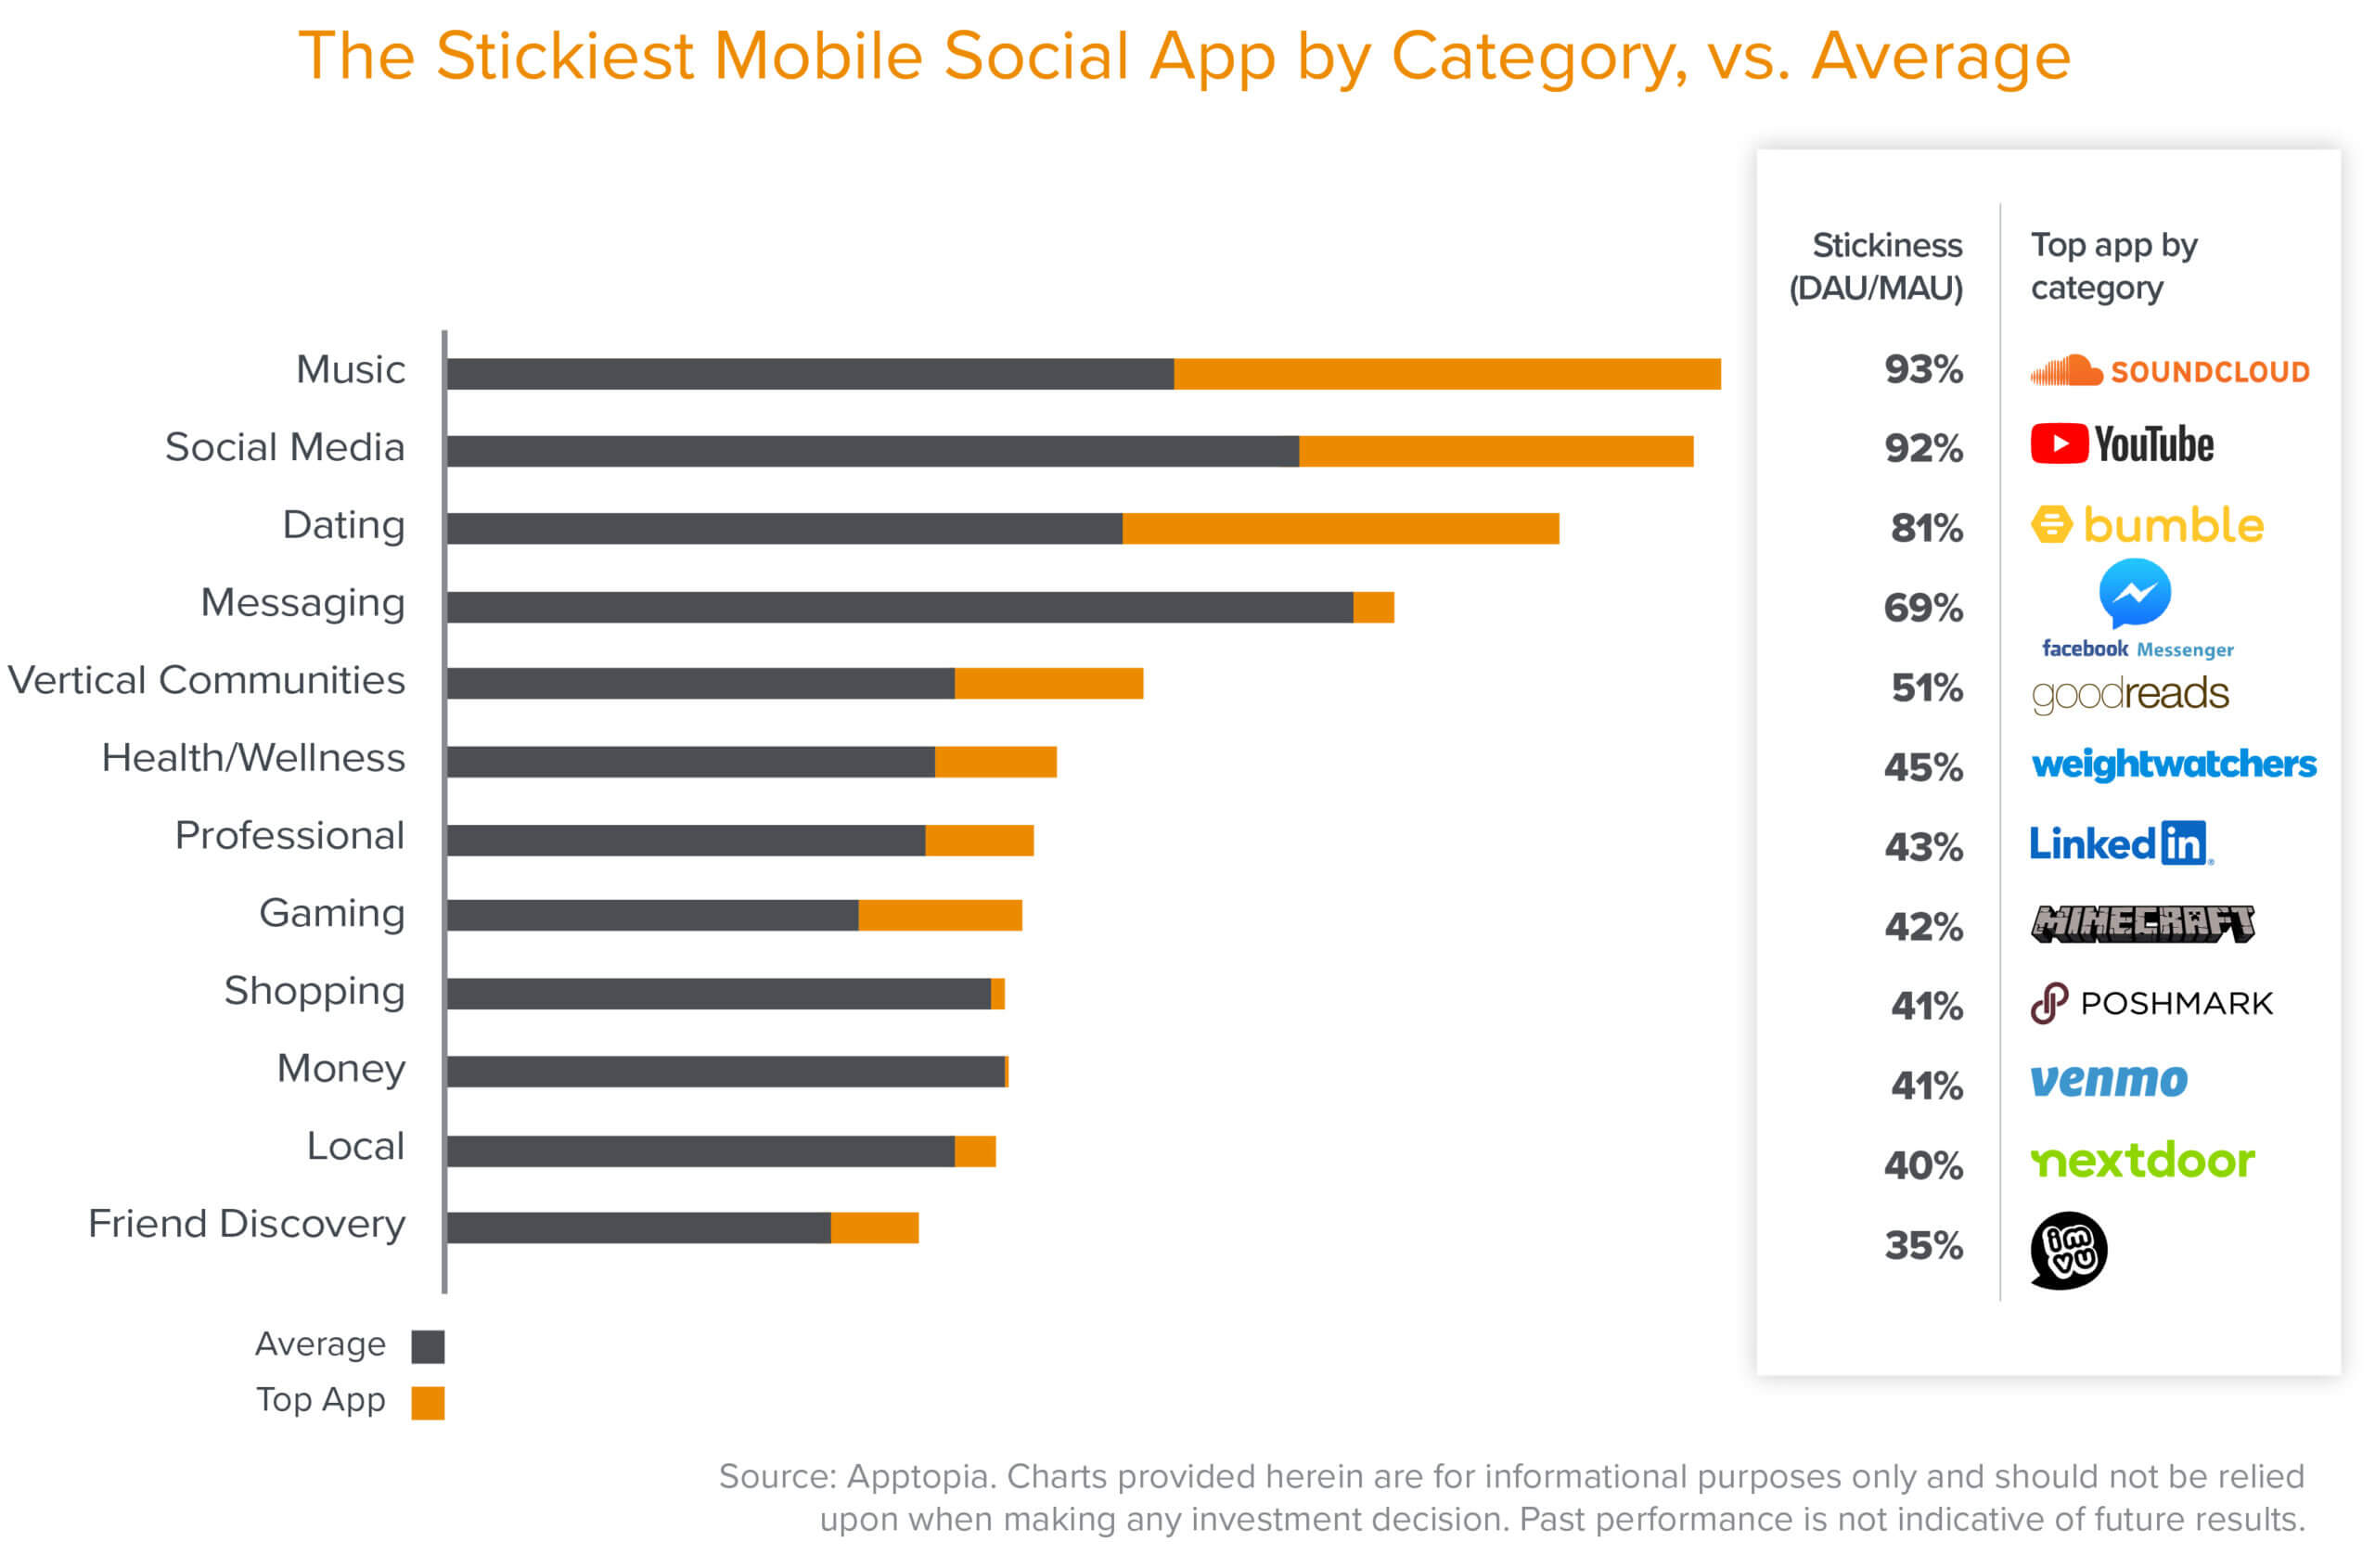
Since DAU/MAU is an extension of the highest-frequency use case, those who download the SoundCloud app or YouTube mobile app tend to consume a lot of media relative to the average web user, as is evident in the graph above. However, there are categories where nuances in the product experience allow certain apps to break out from the rest. In the case of dating apps, Bumble is performing well ahead of the pack (including Tinder, Hinge, et al.) in terms of stickiness. One potential explanation: tackling male-driven spam head on. Unlike its competitors, Bumble’s female-first focus—in heterosexual matches, only female users can initiate contact; in same-sex matches, either can—has allowed the company to expand its feature set from solely dating-focused to friend finding and professional networking. More value for women translates to more reasons to engage with the app and higher stickiness.
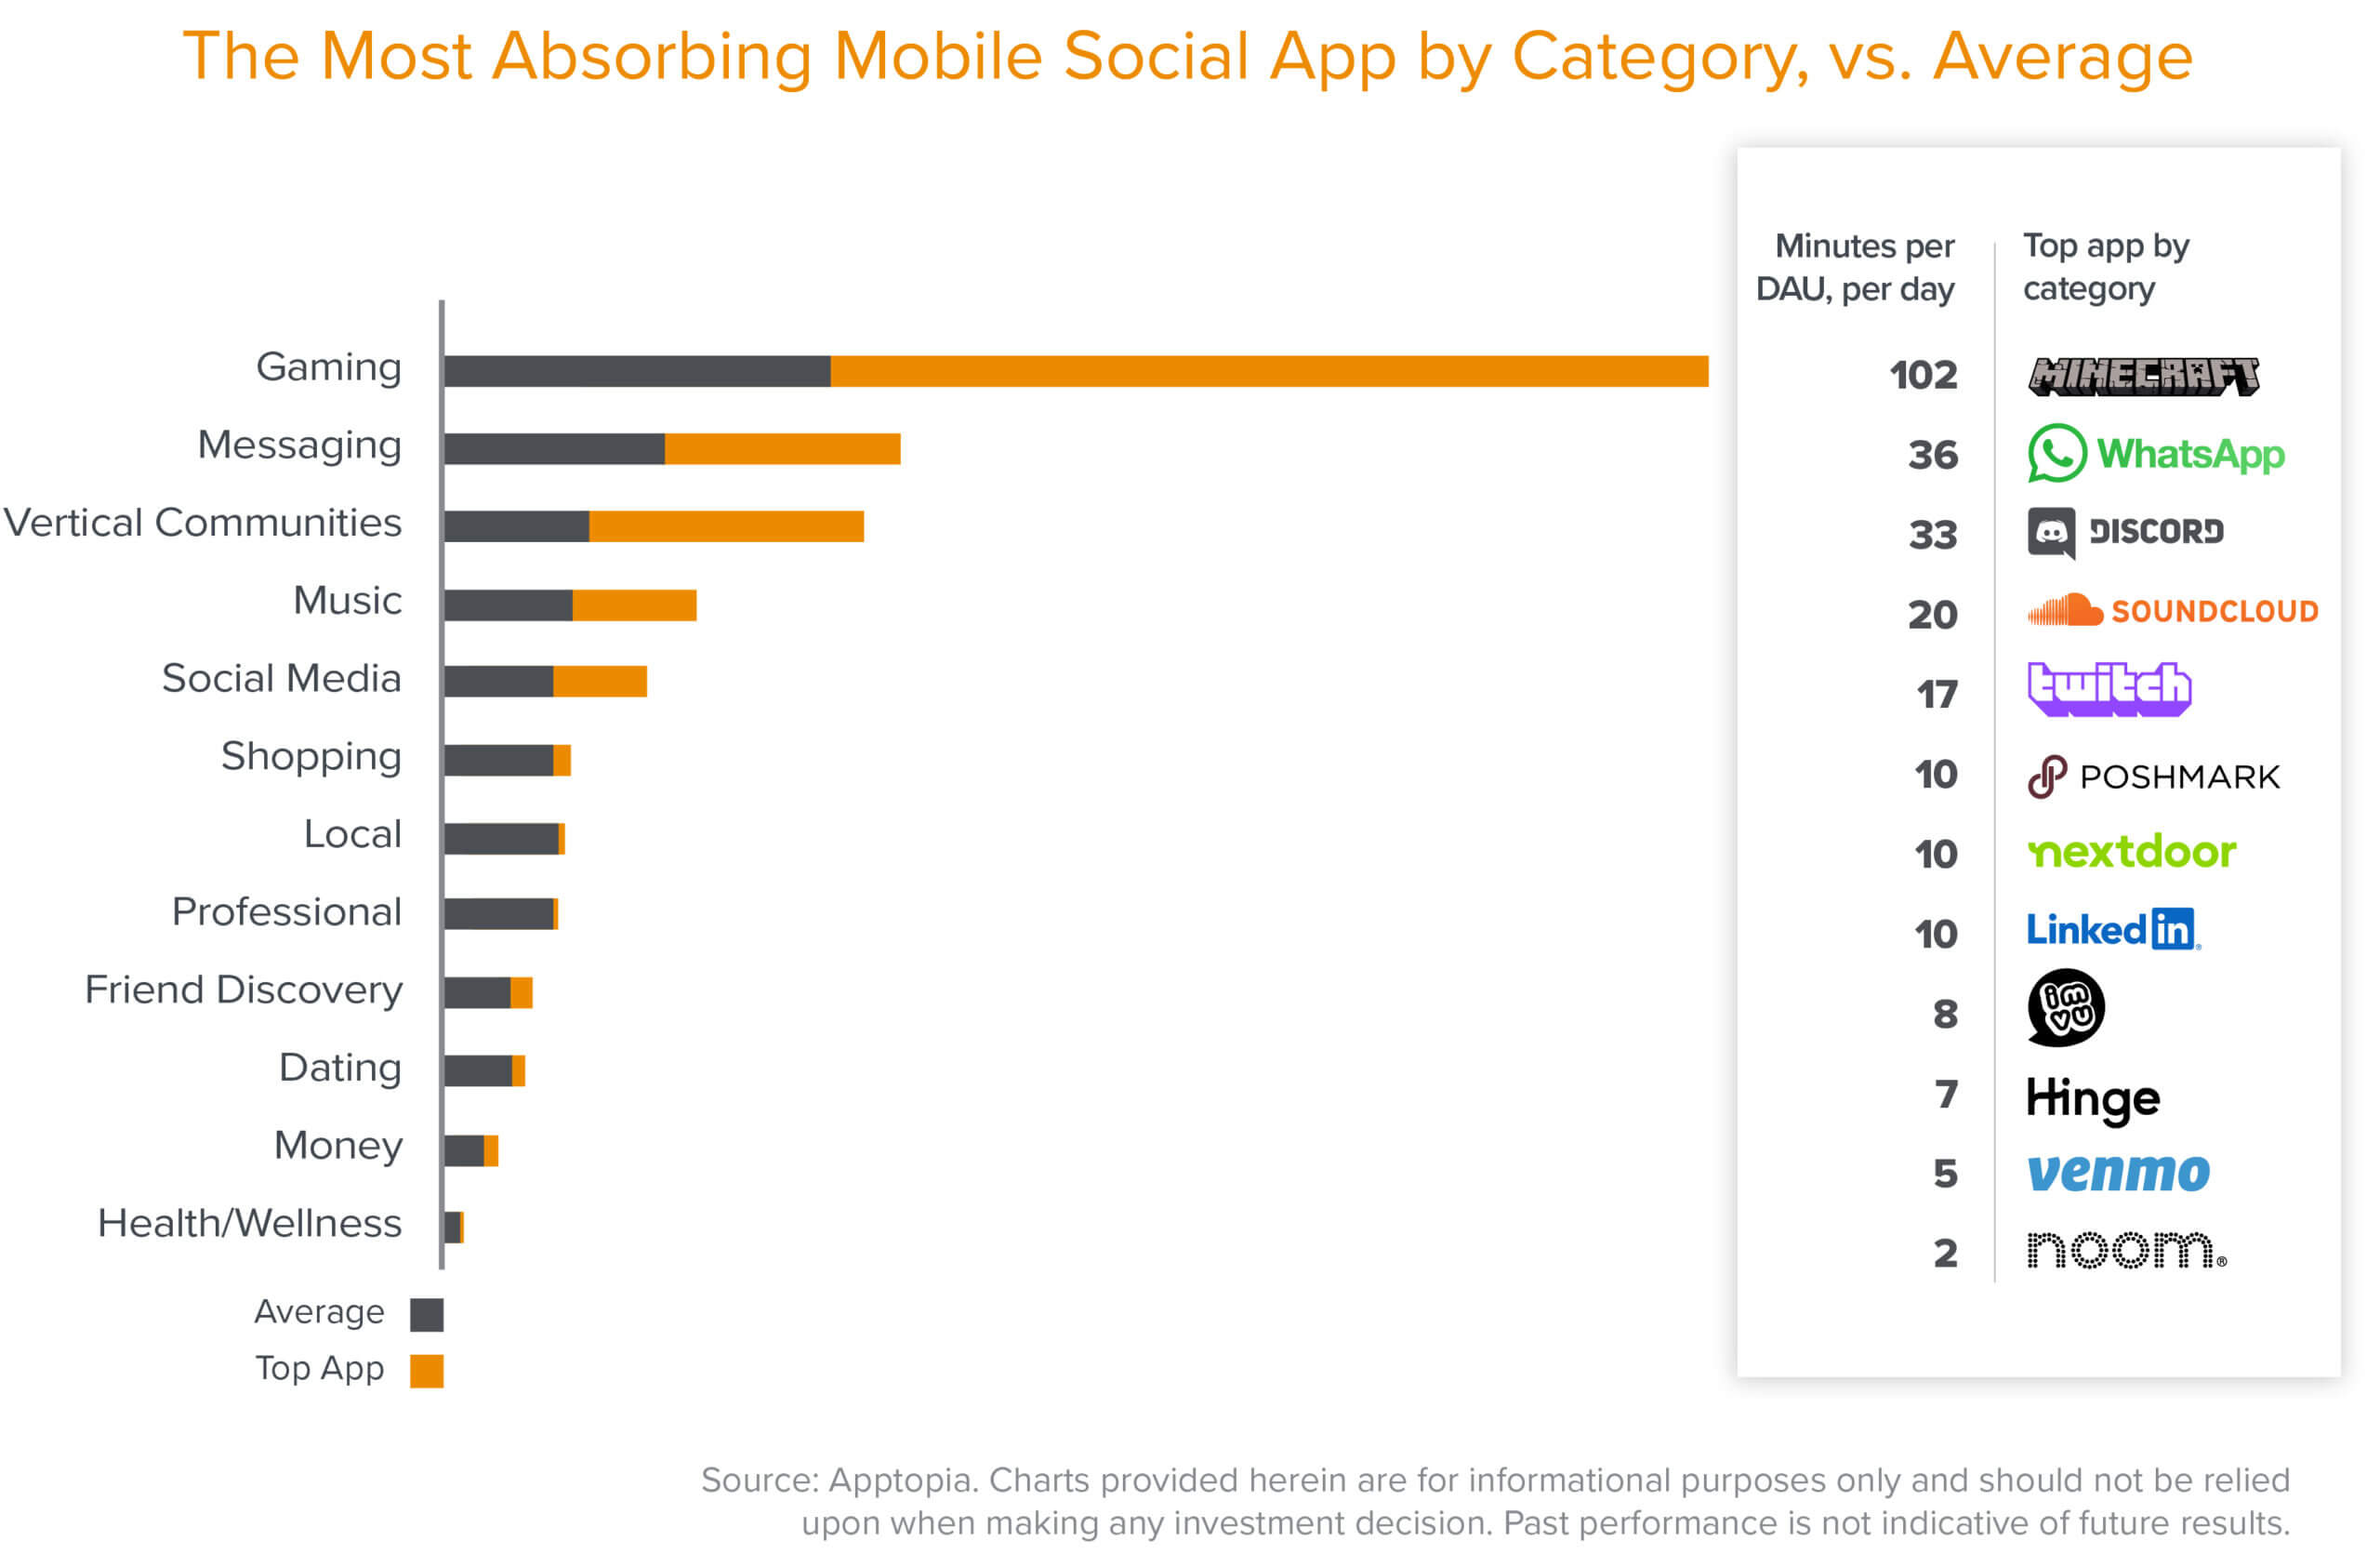
In terms of attention captured, we start to get a sense of how many Americans tend to spend their phone time: playing games, messaging friends, talking about games on Discord, and listening to music. Minecraft’s ability to capture more than 100 minutes of attention per day from its players is impressive. This level of engagement is nearly three times that of WhatsApp—the second highest app in terms of attention—and speaks directly to players’ engagement not only in gameplay, but also with the broader network of players in the Minecraft universe.
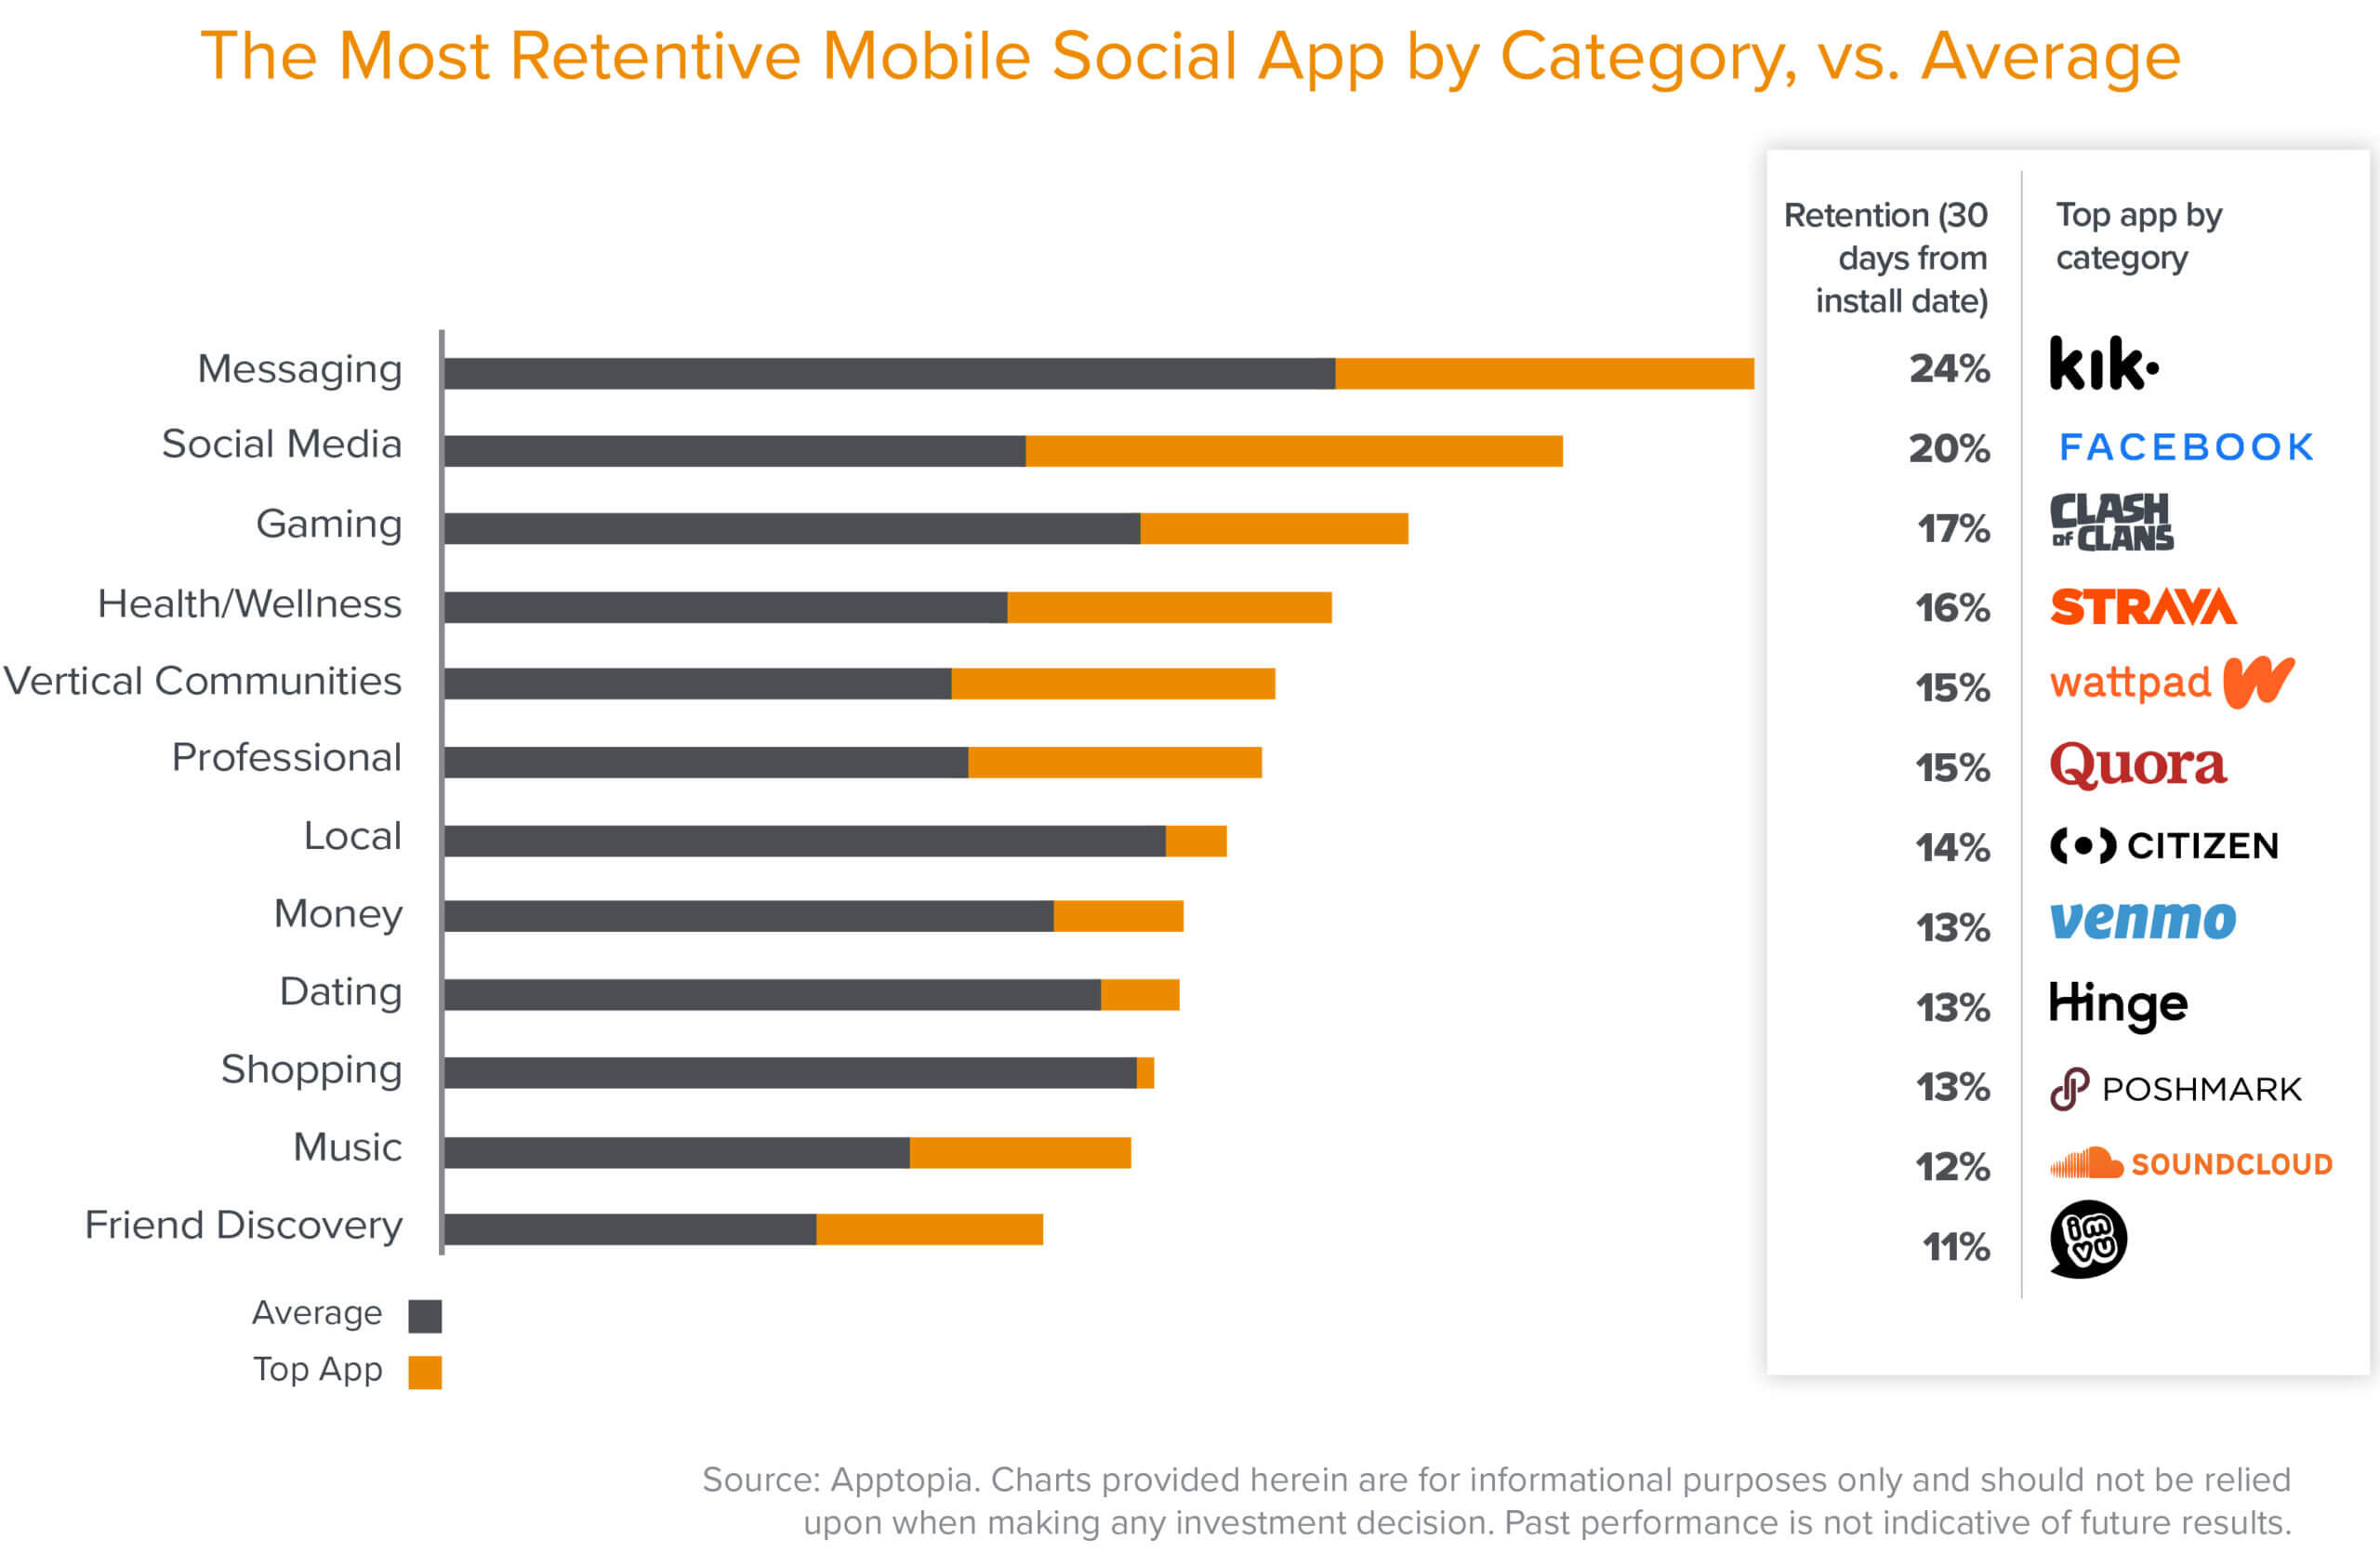
Across all categories, messaging apps retain users the best, with Kik leading the pack. Due to its emphasis on privacy and anonymity, Kik users often skew younger. Sign up requires only an email address, meaning anyone can join without any form of identity verification beyond setting a username. While Kik is far from the largest messenger app in the United States, privacy-sensitive users—often teenagers—engage it often.
Broadly, messaging apps’ high retention rates are emblematic of network effects. Users seek to communicate with their friends and thus join the networks where their friends are. The more friends a user has on an app, the more valuable the network and the app becomes to the user.
Social categories that present opportunities
Though the social media giants may have mastered network effects, a categorical view of the fastest growing social apps provides an intriguing signal for where the next breakout apps may emerge.
Two interesting trends emerge: the rise of friend discovery apps and vertical communities.
Online friend-finding grows
Even prior to March 2020, the propensity of teenagers to meet new friends online had reached meaningful scale. According to the Pew Research Center, over half of teens have made new friends online, while 15 percent have made a close friend online. As IRL options for friend discovery have been put on hold during COVID, teens are continuing to turn to the digital realm to build new friendships. Friend discovery apps like Itsme and Yubo allow users to meet new friends online based on common interests and personality types. Ultimately, friend discovery apps allow for users to grow their social graph, beyond engaging with their existing friends. It’s a promising expansion of a behavior we’ve more commonly seen in social media apps like Instagram, Snapchat, and Facebook. Friend-finding apps may excel at fostering meaningful bonds between users where social media incumbents have thus far fallen short.
There’s value in going niche
A vertical community is a social network based on specific interests and passions. While the network itself consists of community members with shared hobbies—like, say, reading, gaming, or fantasy sports—these apps offer niche-specific features that allow members to further engage with each other. Vertical communities can also better curate content for users; many offer tiered access to various content and features according to the depth or user value.
In the case of the fitness community Strava (which we categorize as “health/wellness,” given its size, but which also qualifies as a vertical community), the performance tracking tool enables users to capture and monitor their own condition, as well as showcase their progress to their network. Illustrating the relationship between niche-specific communities and content engagement, one study of 2,161 Strava activities by researchers at Ghent University found that Strava activity posts were roughly 8 times more likely to receive any sort of community engagement than Twitter posts. This high level of (largely supportive) community engagement, paired with the gamification of activity levels in the app, can ultimately incentivize users to run or cycle more often—and oftentimes to post more.
This combination of utility and community—when it works—leads to two outcomes for the platform: (1) users retain much better than more generalized horizontal networks, since they typically engage with the tool as often as they partake in their hobby, and (2) the community incentivizes further engagement with the underlying niche, which often leads to downstream monetization opportunities for the platform. On the Amazon-owned reading community Goodreads, for example, the combination of book progress tracking tools, community support, and user-generated book reviews fuels the discovery—and thus, purchasing—of new books on Goodreads. I Am Sober, another community-based app, allows users to track their sobriety, derive support from other app users, and share their own stories. While the core utility and community access is free, I Am Sober monetizes through a set of premium features, such as a subscriber badge, access to an iWatch companion app, custom skins, and bonus motivation packs to help users stay on track.
While a vertical community will by definition never boast the massive network scale of a horizontal platform like Facebook, users’ heightened depth of engagement means that vertical communities can, and increasingly will, become billion-dollar opportunities. After all, niche at a global scale isn’t small at all.
As we’ve illustrated throughout this series, we believe that the best version of every product will ultimately be the one that unlocks an intrinsic social component. The data shows that the inherent network effects of top social apps lead to sustained growth, deeper engagement, better retention, and stronger defensibility. But as a builder—especially if you’re a startup competing against existing social giants—measuring your progress and gauging your likelihood of success can be challenging. It’s a constant battle for users’ attention and loyalty.
With this post we aim to demonstrate that there is more than one path to success, as well as a range of benchmarks to aspire to, depending on your category. (Of course, when it comes to social, there’s always room for a bit of magic, alongside hard metrics.) What will the next billion-dollar social app look like? Whether it’s rooted in friend discovery, a niche community, social gaming, or something entirely new, we’re eager to see what’s in store.
Everything you thought you knew about social networks is getting reinvented.
Our new series, Social Strikes Back, explores the hyper-social future of consumer tech.
See more
-

Bennett Carroccio Bennett Carroccio is a partner on the venture investing team, specializing in early stage and venture consumer-facing technology investments. His focus areas include vertical marketplaces, real estate (proptech), logistics, and social networks.