Tracking metrics and benchmarking is a critical part of scaling a growth-stage company, but there are a lot of common failure modes. For instance, it’s easy to fall prey to confirmation bias and manipulate your numbers to tell the story you want to hear about your business—a practice that can trickle down to the rest of your organization and create a culture of numbers-gaming. You can also over-rotate on metrics and benchmarks and focus on driving numbers in the short-term instead of addressing key, long-term business problems. And even once you’ve teed up the right metrics to track, it can be difficult to know how your numbers stack up against those of your peers and assess whether to keep investing in certain parts of your business.
Ultimately, you need good data, as well as rigorous processes for analyzing and putting that data in context, for your numbers to be a reliable navigation tool as you scale.
As late stage investors, metrics are an essential part of performing due diligence and making sound investing decisions. We’ve reviewed materials from thousands of growth-stage companies, sit on the boards of dozens of late-stage startups, and speak with founders daily about their business metrics. Pulling data from companies who have scaled successfully and calling on our decades of investing expertise, we built the Guide to Growth Metrics to help founders and their teams understand which metrics actually matter and what those metrics can tell them about their company as they scale. In this release, we’ve included benchmarks for B2B companies, but we’ll add additional cohorts and continue to update the underlying data set to reflect shifts in business metrics over time.
There are a number of benchmarking and metrics guides available online today, but we believe a few features make this a uniquely useful guide for growth-stage founders and teams.
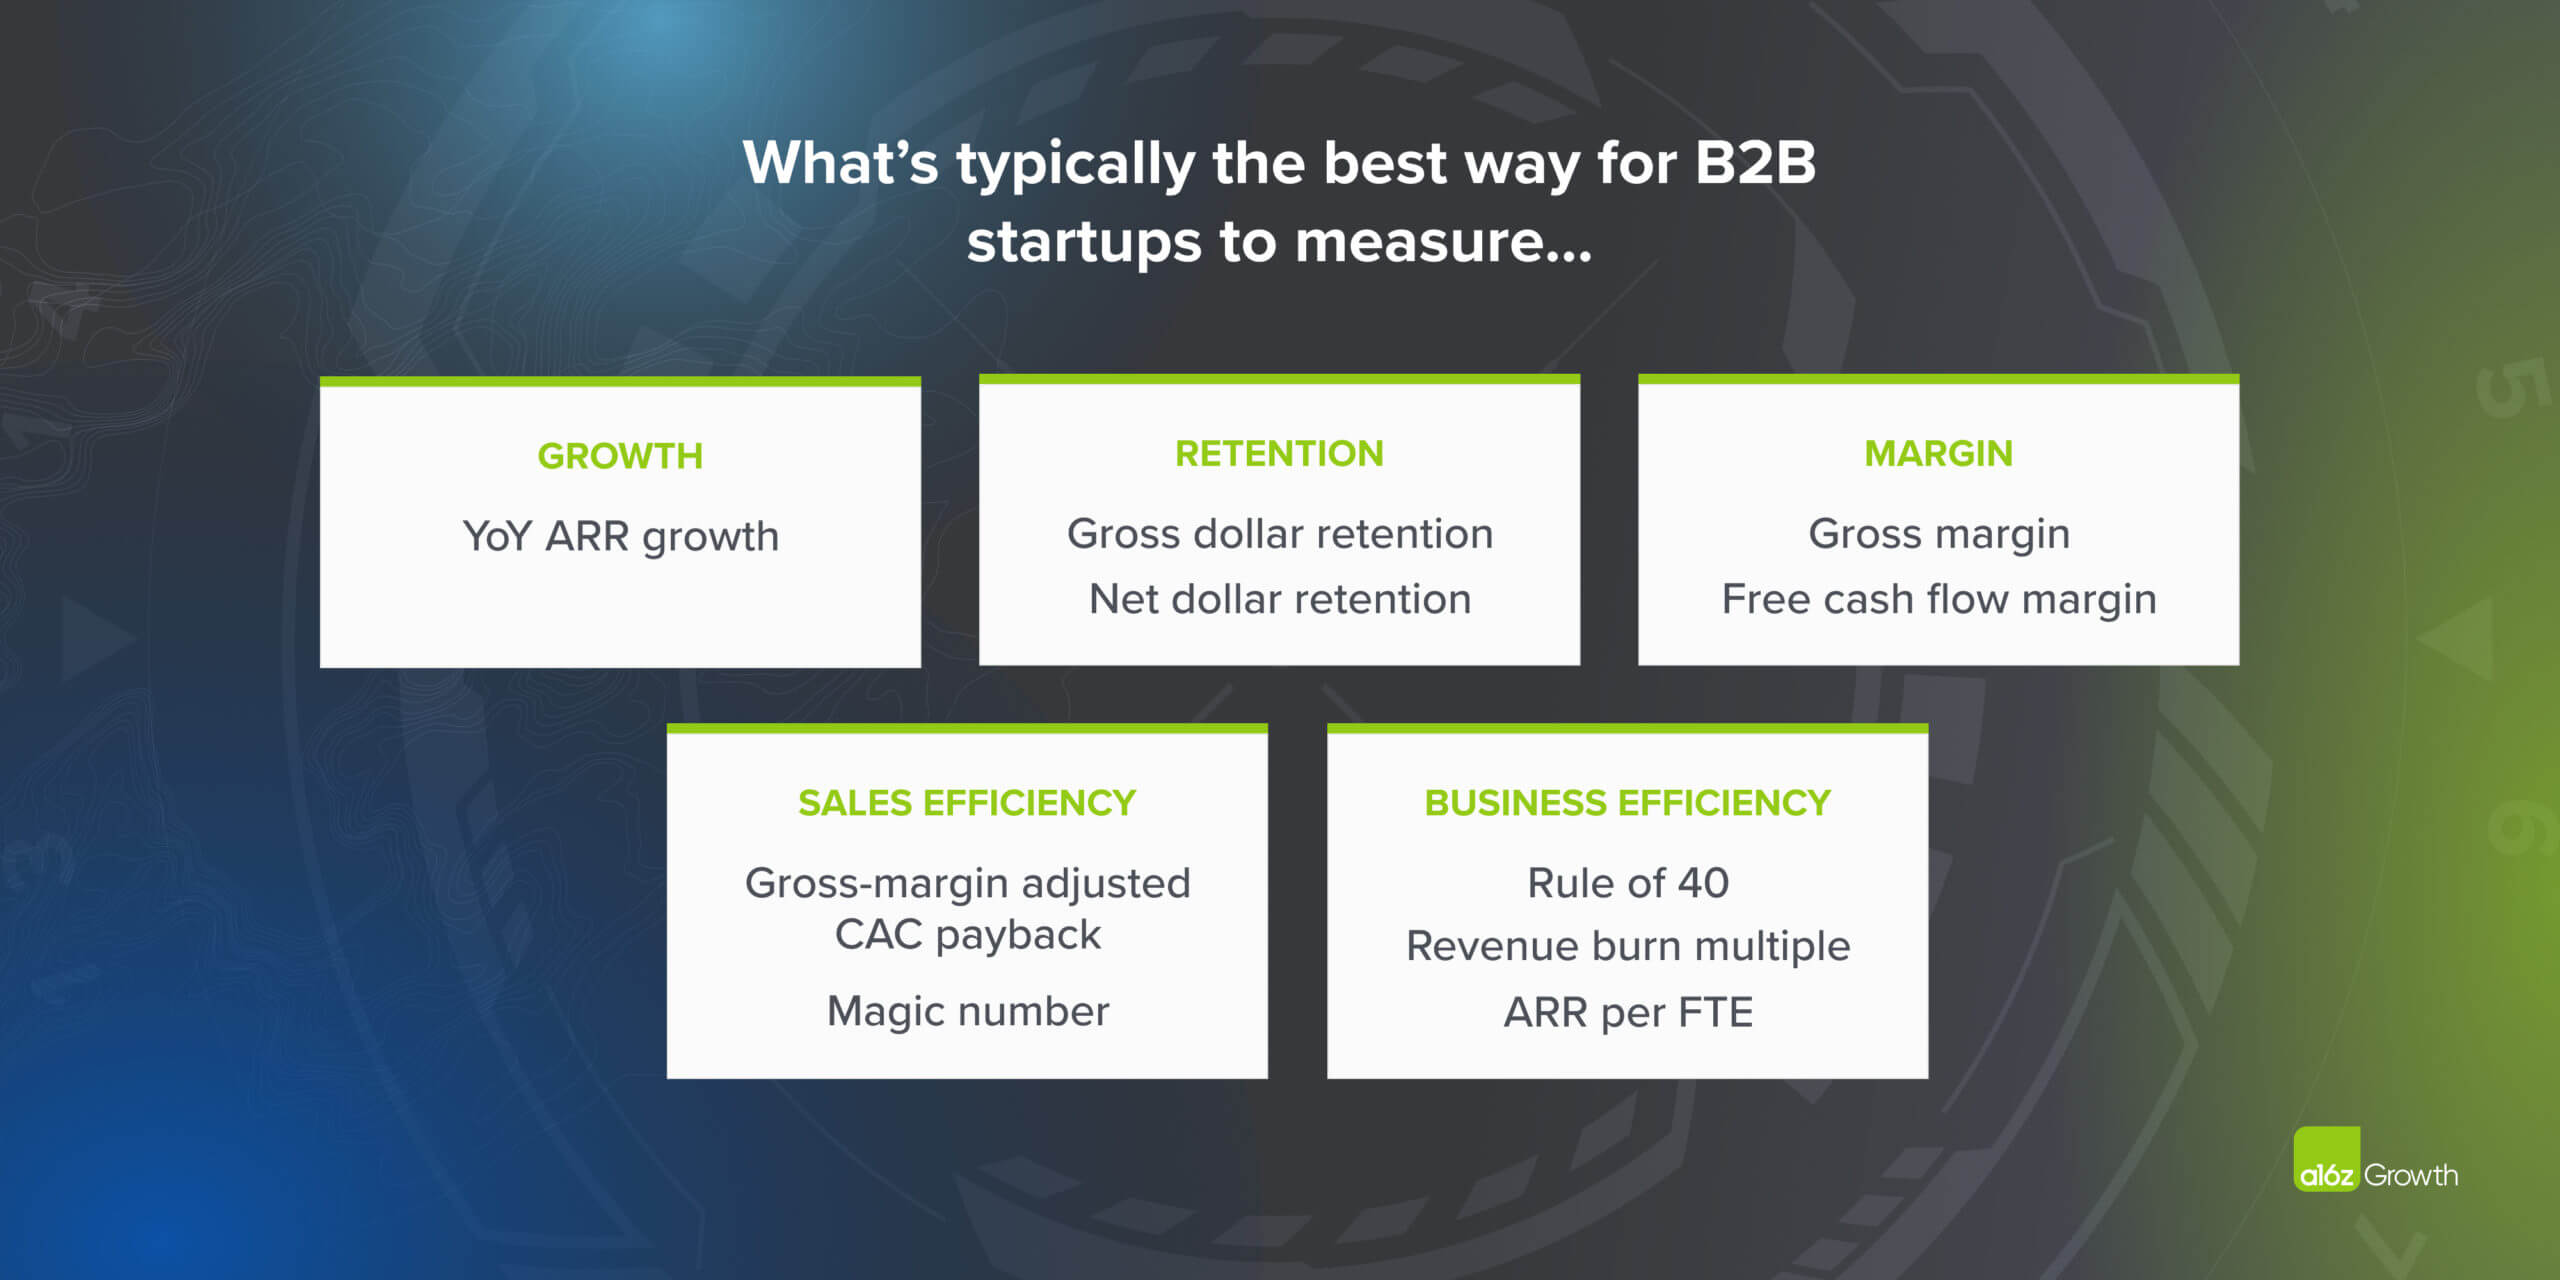
Impactful metrics. It all starts with the metrics we’ve included. We went through extensive internal debates to select the metrics that are typically the most significant indicators of a company’s growth, efficiency, retention, and margins.
High-quality data. Once we finalized our list of metrics, we built out a corresponding anonymized dataset using quarterly and annual operating and financial data from hundreds of companies, either in our portfolio or who shared their data with a16z Growth, from 2014 through 2021. Because our data is pulled from a more optimistic operating and investing environment and because our team typically interacts with startups that have successfully scaled, note that calculations might reflect an upward bias.
Different startups use different methods to calculate and report metrics, so we standardized our metrics calculations. For instance, some companies adjust CAC payback for gross margins and some don’t. To compare performance consistently across companies, we gross margin-adjusted all our CAC paybacks.
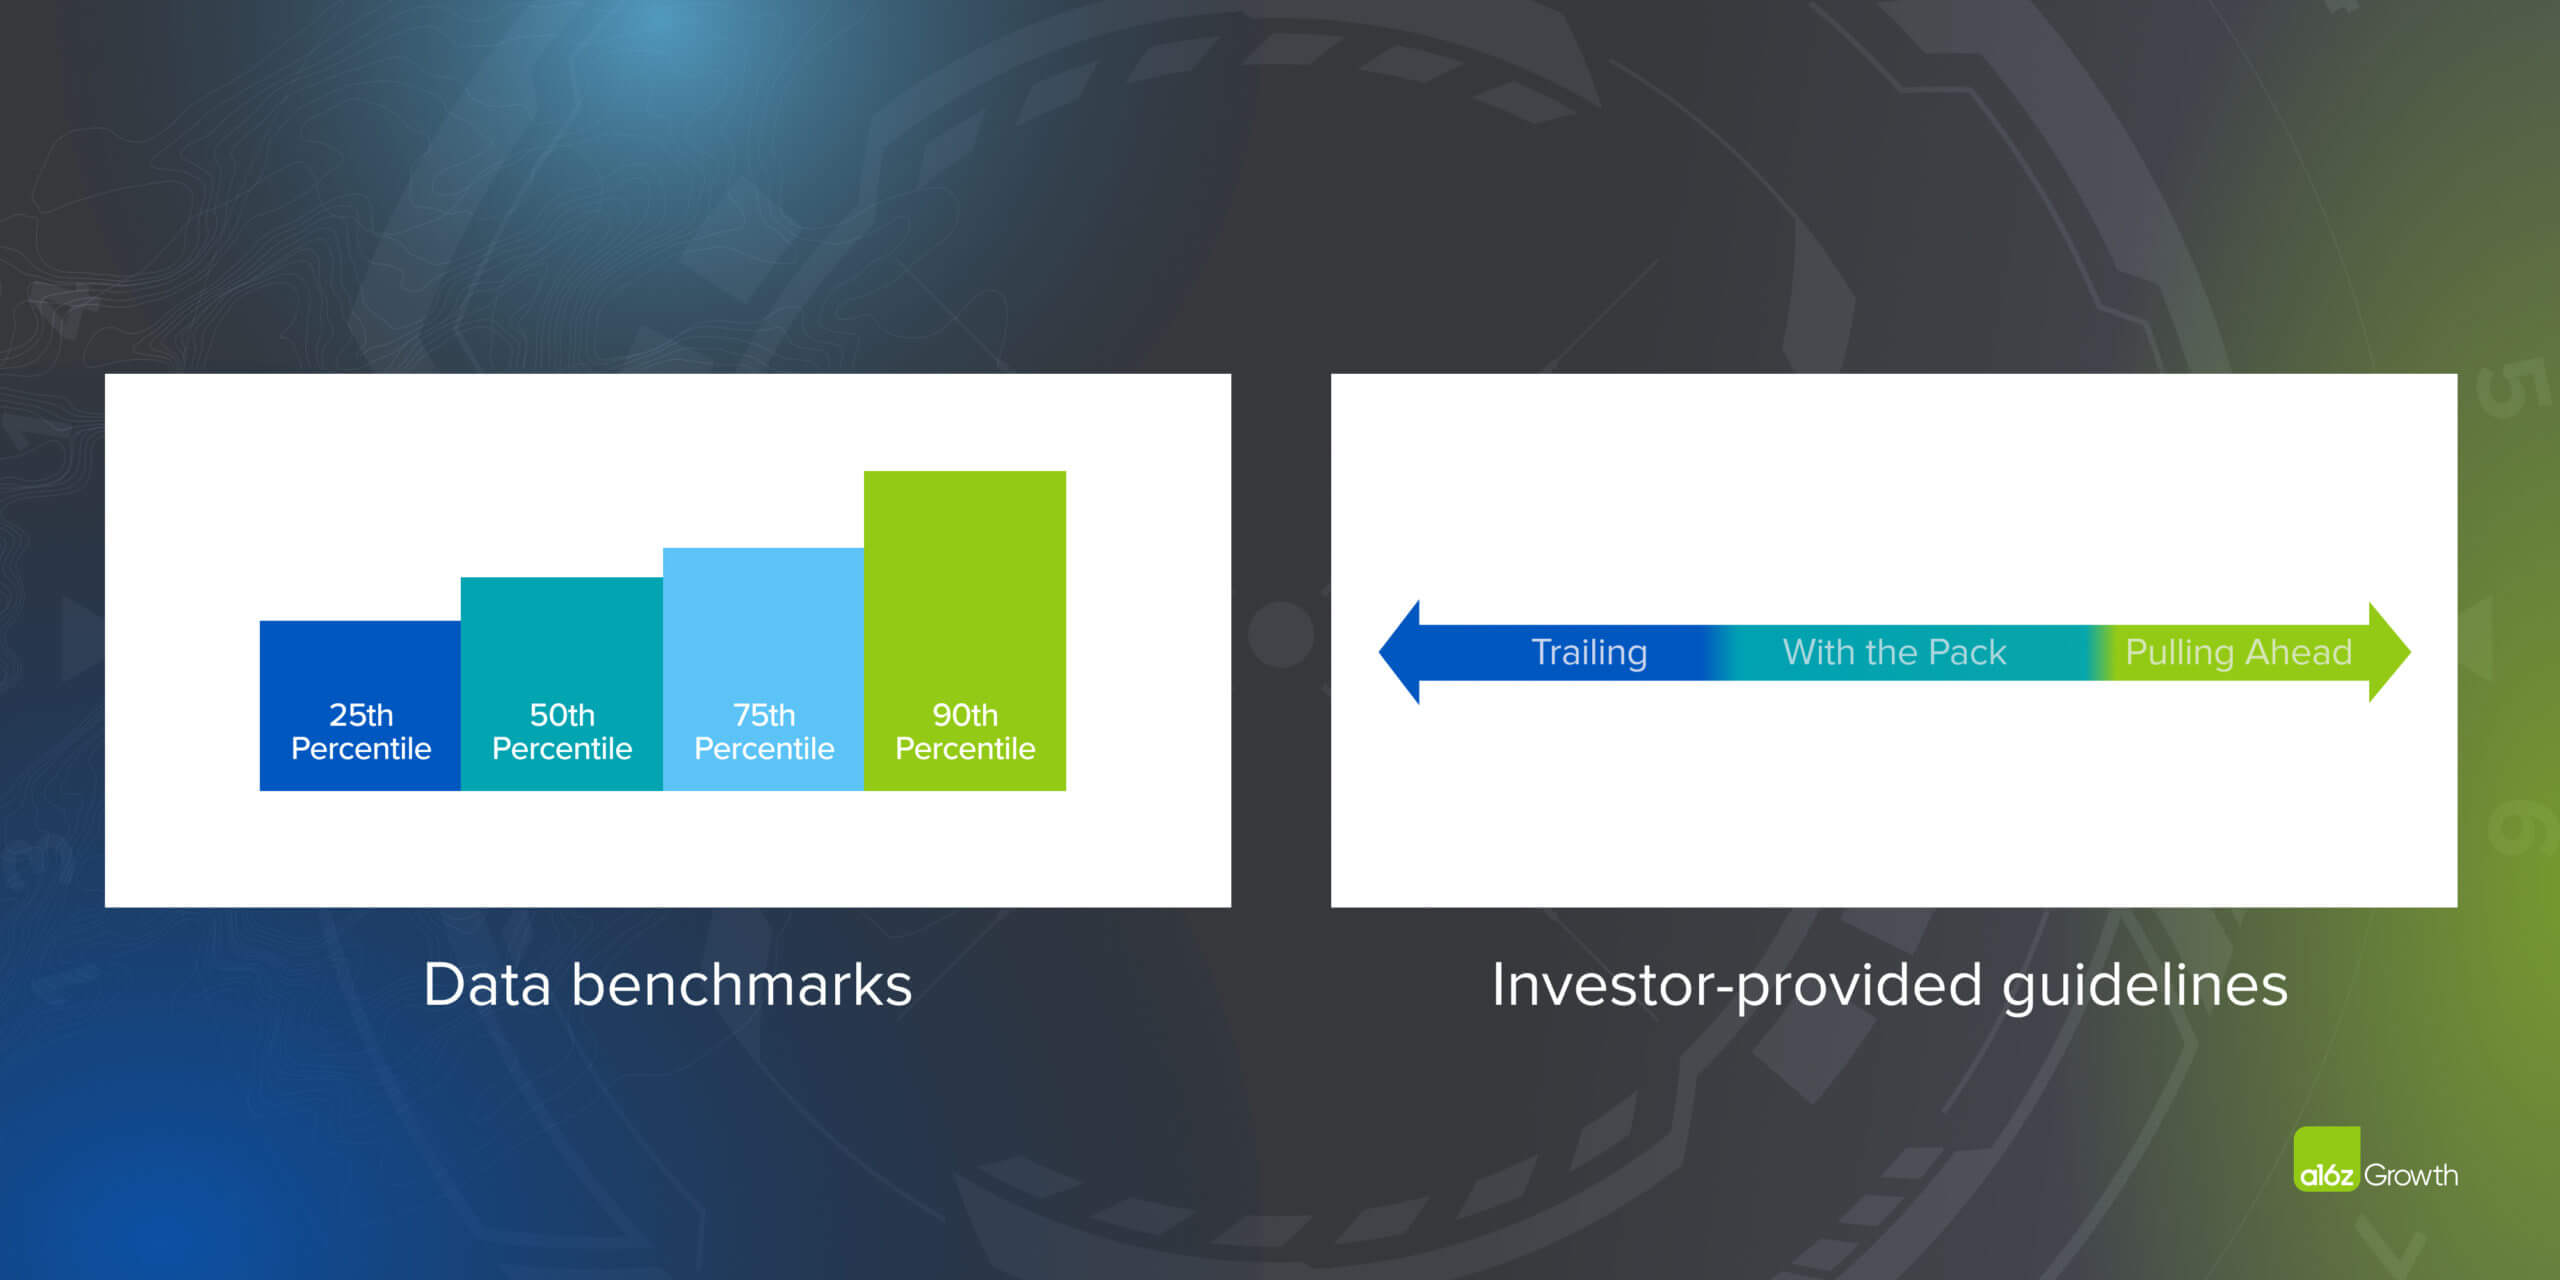
Finally, we calculated the majority of the metrics on an annual basis to more accurately reflect the context in which management teams and investors use these metrics. For ARR growth, rule of 40, gross margin, and free cash flow margin, we supplemented yearly data with annualized quarterly and monthly data points to build out a more representative data set. We then aggregated all our data and benchmarked the 25th/50th/75th/90th percentiles of performance.
Meaningful segmentation. Metrics are most meaningfully influenced by the scale at which a company operates, how they get their product in front of customers, and what type of product they’re selling. Once we finalized our data set, we segmented our data to reflect differences in revenue scale, go-to-market motion (i.e., top down or bottom up), and, for top-down companies, type of software sold (i.e., application or infrastructure). For instance, if you’re an early-stage company with a bottom-up go-to-market strategy, you don’t need to invest in an expensive sales team, which likely means your business is more efficient.
Expert context and analysis. Of course, data sets in the real world are rarely complete, and even with all the data we collected and reviewed, there were areas where we lacked sufficient data, or an ability to effectively normalize data, to provide statistical benchmarks. In those cases, our team defines what they consider to be “trailing,” “with the pack,” and “pulling ahead” indicators of performance, based on their combined decades of investing.
Benchmarking and metrics only tell part of the story. Finding out that you’re performing at the 25th percentile for a certain metric doesn’t necessarily mean that your company is failing, but it is an important indicator that you need to pay attention to. In many cases, the trend is more important than the current data point. For each metric, we’ve provided our perspective as investors and board members on how to best put the number into context.
This guide is far from a definitive account of what excellence looks like at scale or a prescription for what to do based on your numbers. As Ben Horowitz has said, the map isn’t the terrain. Every company is different, and you’re the expert on yours. That said, we hope this guide gives a richer context that helps you both assess how your company is performing and craft the story of your business for investors, employees, and the broader market.
Have thoughts on what you’d like to see in a Guide to Growth Metrics? Let us know.


