When we released a16z Growth’s Guide to Growth Metrics at the end of last year, one of the biggest requests we received from founders was more information about how companies in our dataset were affected by 2022 macroeconomic conditions. We’re all familiar with the same story about 2022: the directive to grow at all costs shifted seemingly overnight to an emphasis on efficient growth, and this shift required many companies to make significant changes across their businesses. But how did these shifts actually impact companies’ metrics, and how should companies view their metrics in light of these new benchmarks moving forward? We put together this bulletin to help founders understand how their own numbers might stack up in the current climate.
TABLE OF CONTENTS
How did companies’ metrics shift in 2022?
TABLE OF CONTENTS
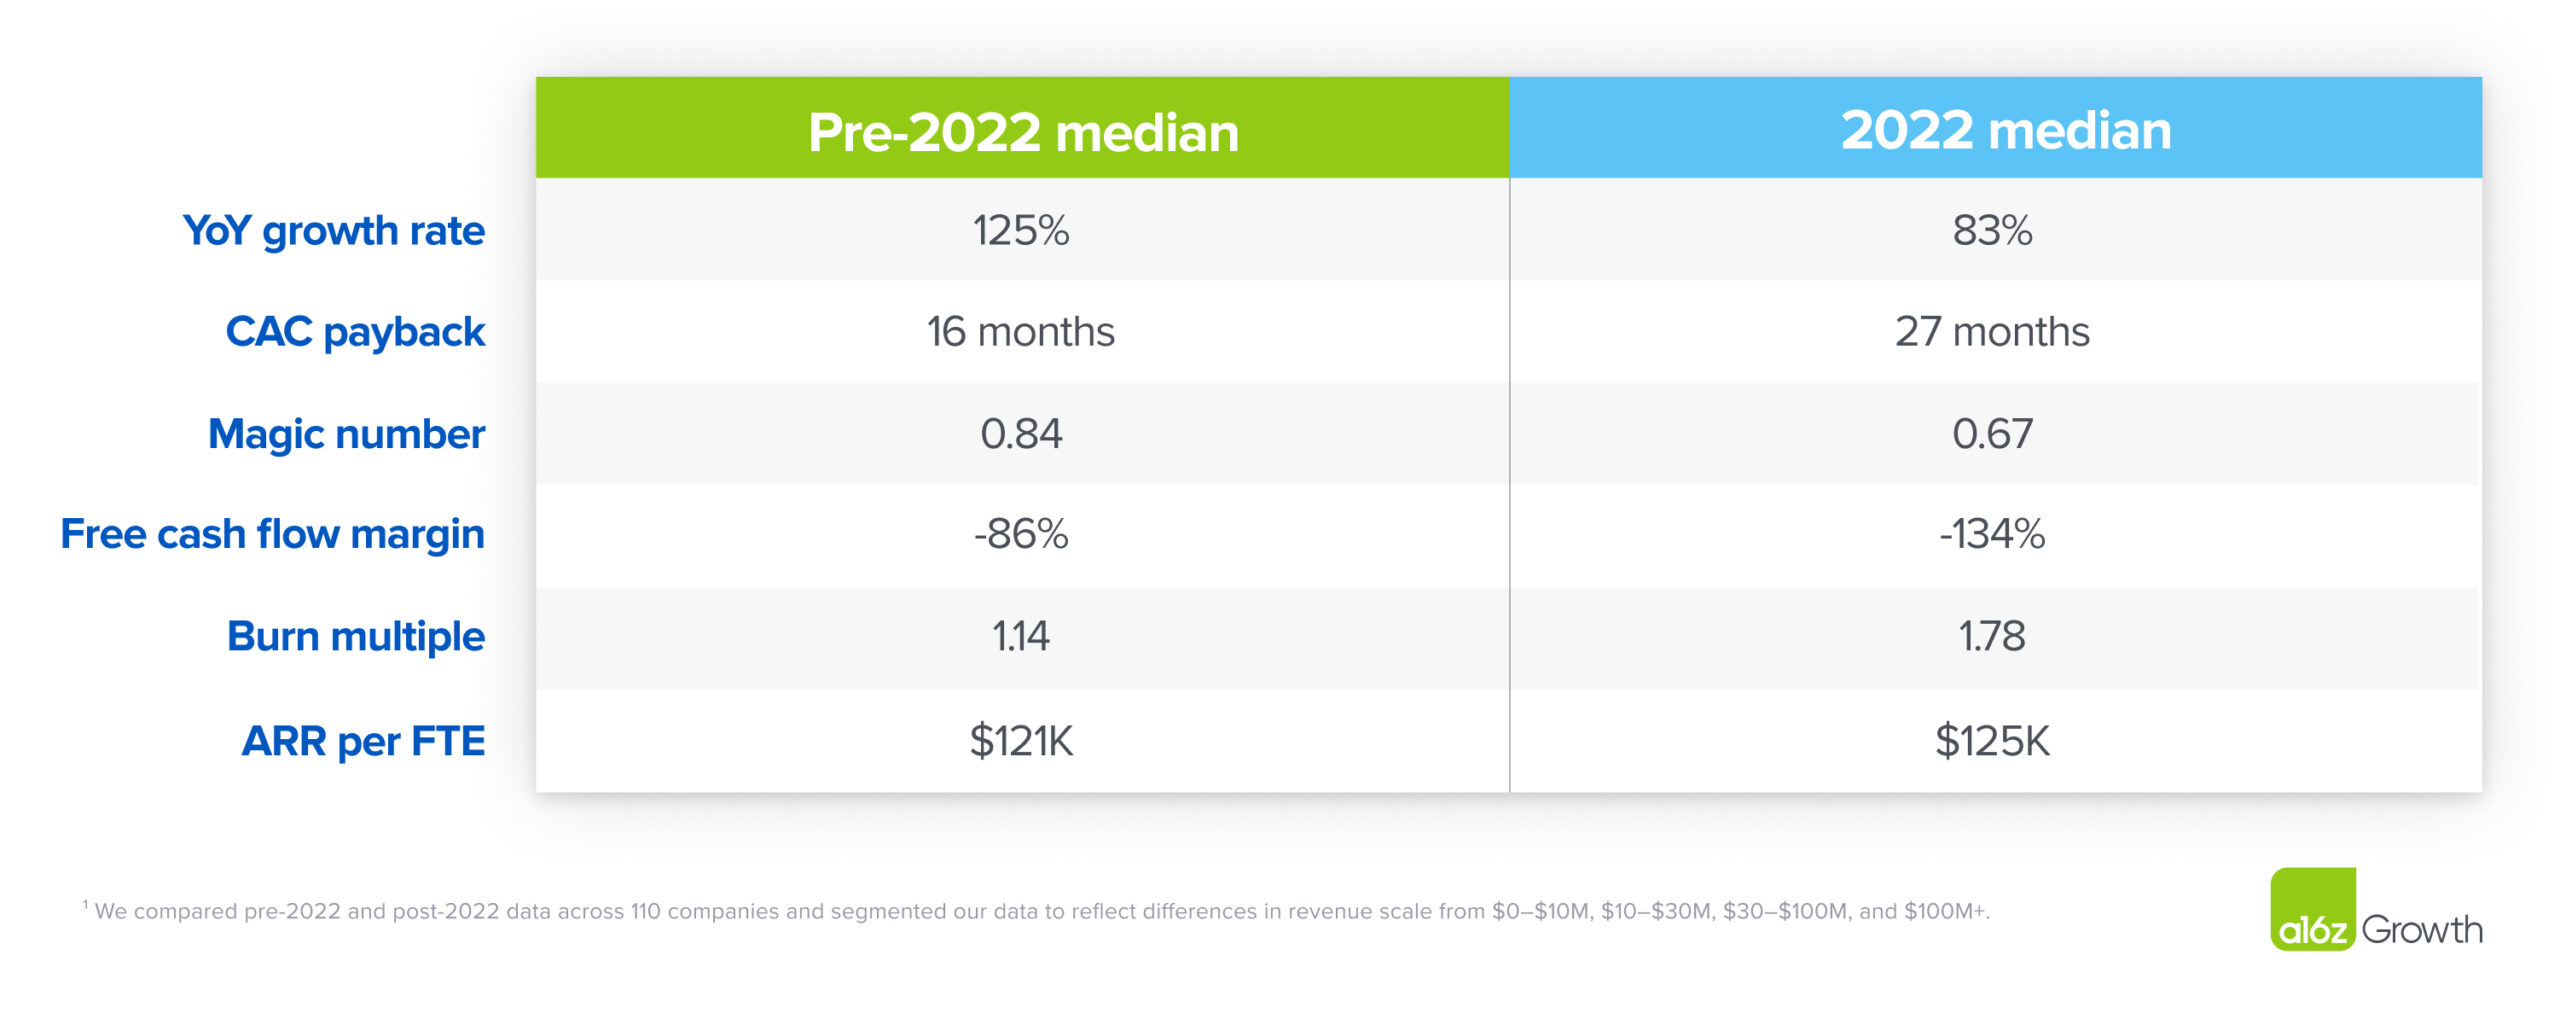
Across all companies in our dataset, we observed the following:
What’s the story about 2022?
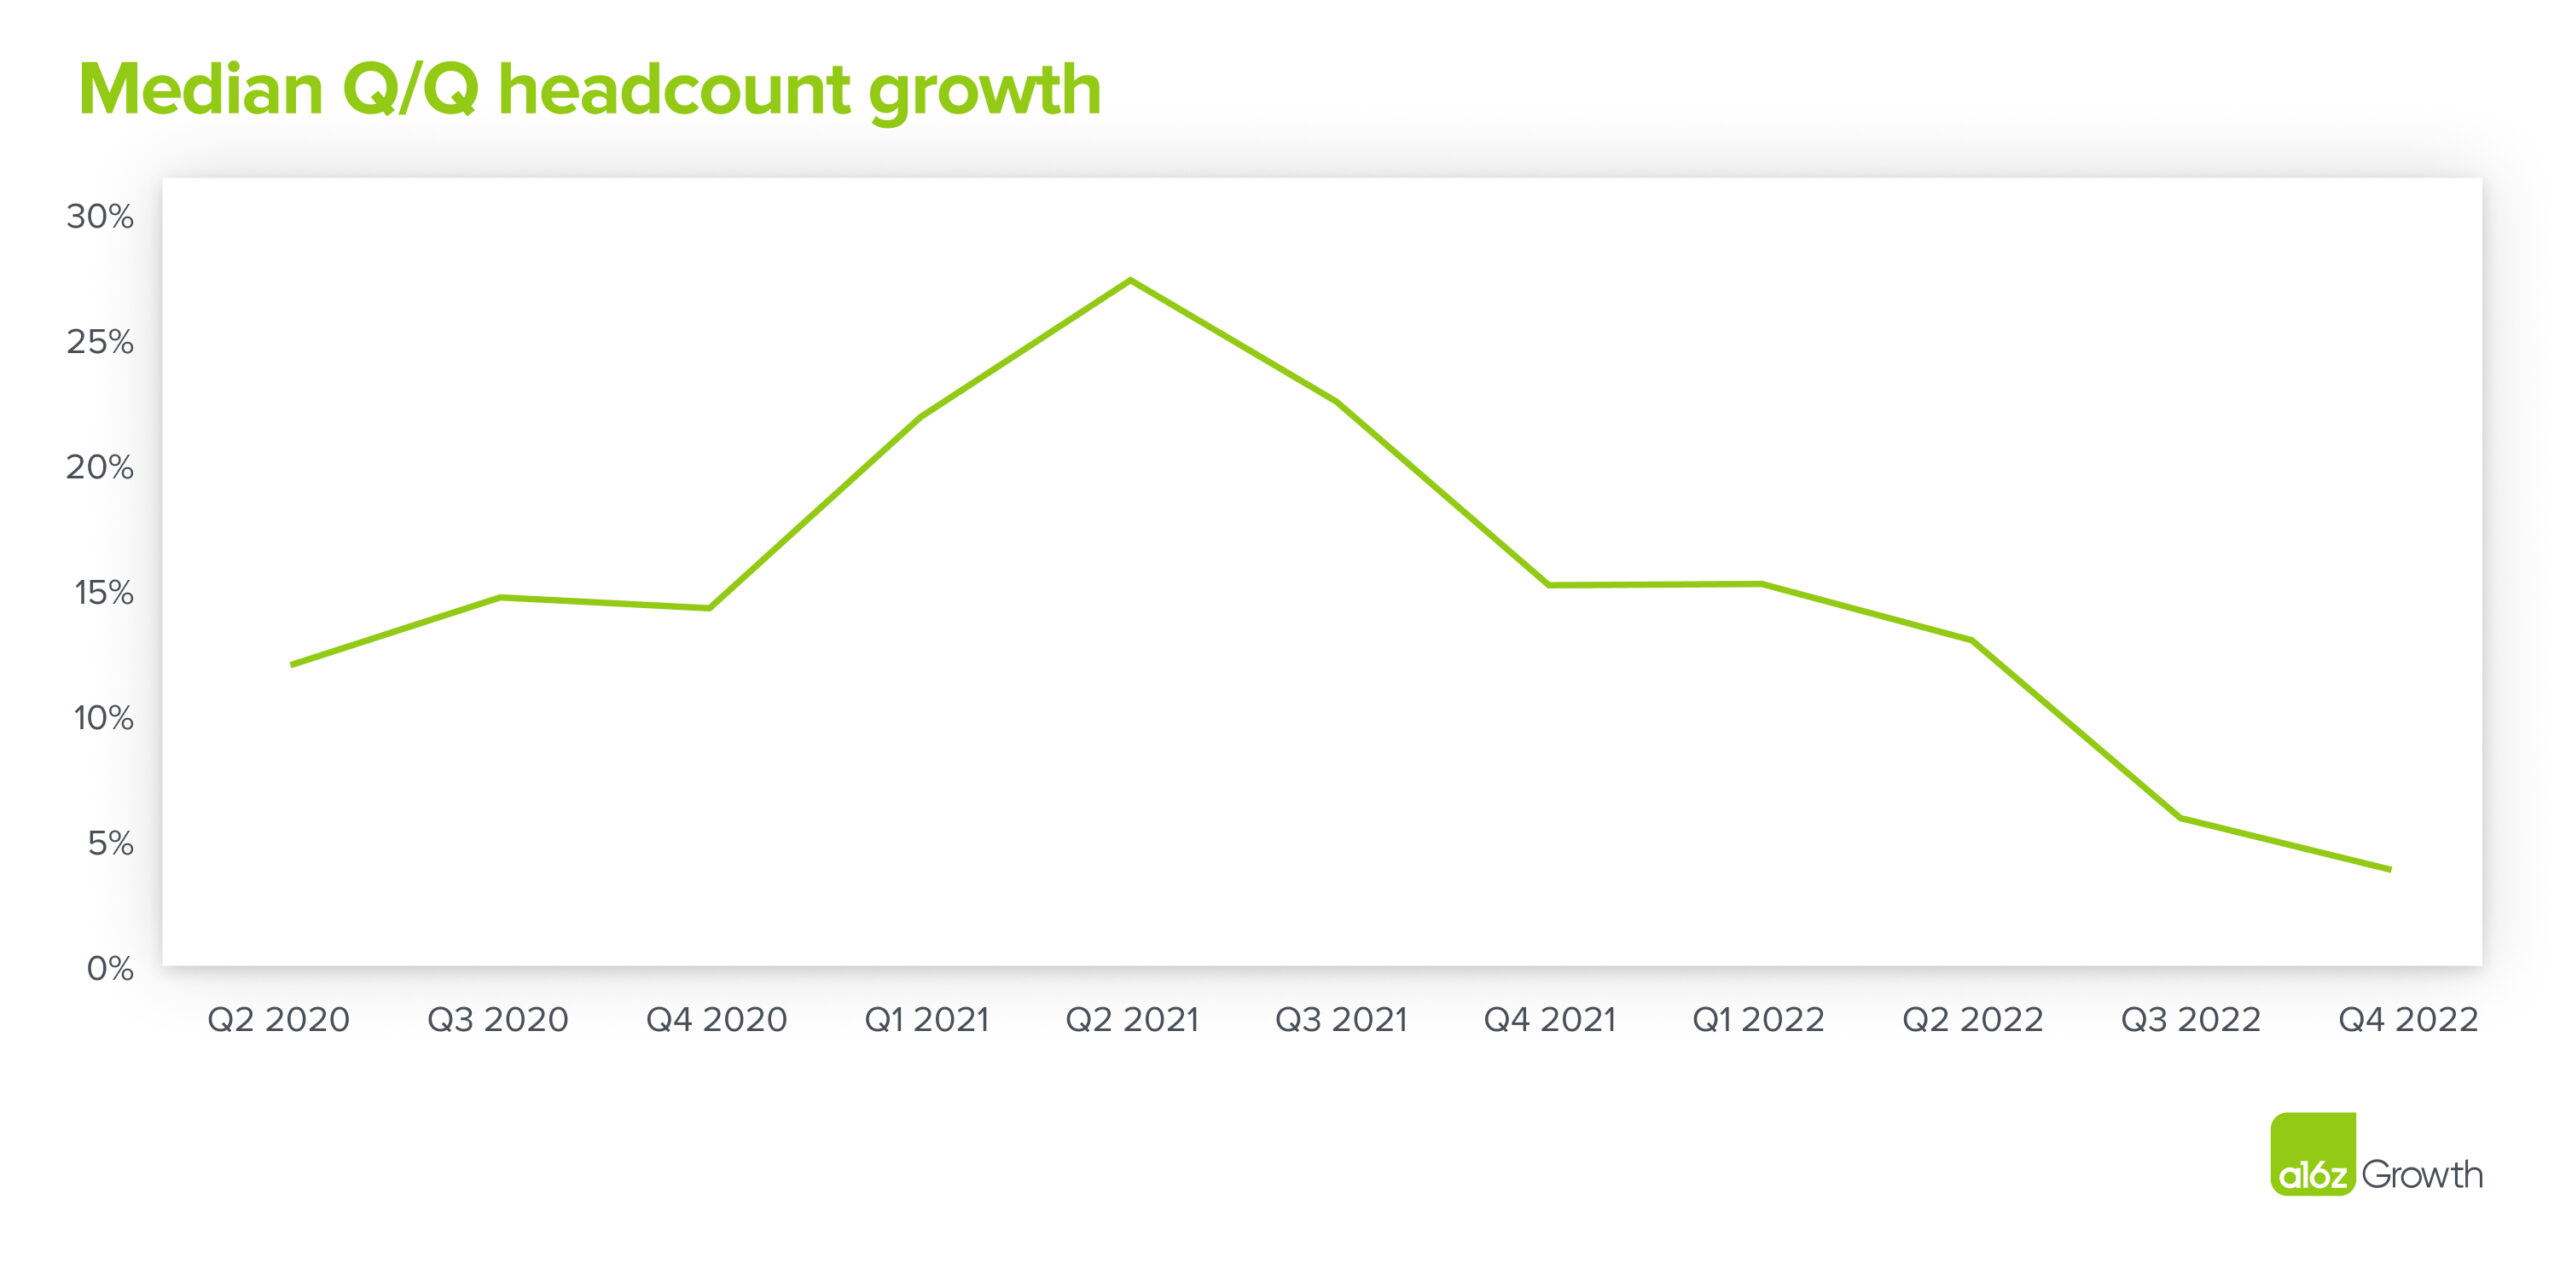
At a high level: companies hired rapidly in 2021 in anticipation of continued significant growth, but instead faced severe macroeconomic headwinds and uncertainty in 2022 that made it much harder to sell. When demand didn’t materialize, efficiency—particularly sales efficiency—worsened, driving burn upwards. 2022 growth couldn’t keep up with the jumps in burn, so many companies responded by reducing headcount (see below).
Due to timing and severance pay, however, the impact of those reductions often took several quarters to be reflected in company financial statements and, as such, didn’t roll through the business quickly enough to combat worsening free cash flow margins.
Growth
Digging into our dataset, we saw significant declines in YoY growth across all revenue scale buckets over $10M in 2022 (from $10M to $30M, $30M to $100M, and $100M+). 2021 was a year of spectacular growth for many companies, averaging 200% or 3x for companies operating between $10M ARR and $30M ARR in particular. But by the end of 2022, 2x growth became the new 3x growth for companies operating in this range.
Sales efficiency
Selling in the face of headwinds made sales and marketing much less efficient: magic numbers fell below 0.75 and CAC payback periods elongated across all revenue ranges. Payback periods extended the most for smaller companies and companies with top-down sales motions. Smaller companies were less likely to have a tight grasp on their repeatable sales levers and were overinvested in sales resources, while companies with top-down sales motions typically have higher ACVs, and these contracts came under greater scrutiny by CFOs when the time came to tighten the belt.
Burn
Together, lower demand and less efficient sales and marketing spend led to free cash flow margins worsening—which, in turn, led to lower rule of 40.
What’s next?
While the macro environment continues to be challenging for some, founders now have more game film on how to navigate these challenges effectively—and are already reaping the rewards of course-correcting.
Specifically, many companies are choosing not to raise right now and are instead taking a more moderate approach to growth targets and burn forecasts in order to elongate their runway and preserve optionality. Growth rates continue to be slower than pre-2022 levels, and we’re still seeing longer sales cycles—for some companies, it’s taking twice as long to get through the final pipeline stages. That said, we’re seeing companies focus on improving their burn multiples and rules of 40 by being rigorous about sales efficiency. Specifically, we’ve seen a renewed focus on revenue operations, from applying more sales resources to high ROI customer segments to dropping more experimental segments. Smaller and leaner teams as a result of reductions have often enabled companies to innovate and build products more quickly, and are seeing ARR per FTE improve, which can often be a leading indicator of performance given how long it takes for headcount reductions to be reflected in company cost structures.
We’ve also seen many companies leverage AI to make significant productivity gains in engineering, customer support, and marketing, and we expect that trend to continue across major operating expenses over the upcoming year. These new investments have already started to drive a renaissance in both product development and internal functions, creating exciting new revenue drivers and avenues for renewed growth and acceleration.
When it comes to metrics and benchmarking, the map isn’t the terrain: you’re the expert on your own business. That said, having a good handle on your metrics and how your company stacks up against the competition can not only help you navigate the tough times, but also build a business for the long haul. Looking back at 2022, founders had to make tough decisions, but their companies are in a much healthier position as a result—and we’re excited to see what they build next.
The views expressed here are those of the individual AH Capital Management, L.L.C. (“a16z”) personnel quoted and are not the views of a16z or its affiliates. Certain information contained in here has been obtained from third-party sources, including from portfolio companies of funds managed by a16z. While taken from sources believed to be reliable, a16z has not independently verified such information and makes no representations about the enduring accuracy of the information or its appropriateness for a given situation. In addition, this content may include third-party advertisements; a16z has not reviewed such advertisements and does not endorse any advertising content contained therein.
This content is provided for informational purposes only, and should not be relied upon as legal, business, investment, or tax advice. You should consult your own advisers as to those matters. References to any securities or digital assets are for illustrative purposes only, and do not constitute an investment recommendation or offer to provide investment advisory services. Furthermore, this content is not directed at nor intended for use by any investors or prospective investors, and may not under any circumstances be relied upon when making a decision to invest in any fund managed by a16z. (An offering to invest in an a16z fund will be made only by the private placement memorandum, subscription agreement, and other relevant documentation of any such fund and should be read in their entirety.) Any investments or portfolio companies mentioned, referred to, or described are not representative of all investments in vehicles managed by a16z, and there can be no assurance that the investments will be profitable or that other investments made in the future will have similar characteristics or results. A list of investments made by funds managed by Andreessen Horowitz (excluding investments for which the issuer has not provided permission for a16z to disclose publicly as well as unannounced investments in publicly traded digital assets) is available at https://a16z.com/investments/.
Charts and graphs provided within are for informational purposes solely and should not be relied upon when making any investment decision. Past performance is not indicative of future results. The content speaks only as of the date indicated. Any projections, estimates, forecasts, targets, prospects, and/or opinions expressed in these materials are subject to change without notice and may differ or be contrary to opinions expressed by others. Please see https://a16z.com/disclosures for additional important information.

