People who’ve been in crypto for a long time view the space as evolving in cycles, alternating between periods of high activity and “crypto winters.” There have been three cycles so far. The first peaked in 2011, the second in 2013, and the third in 2017.
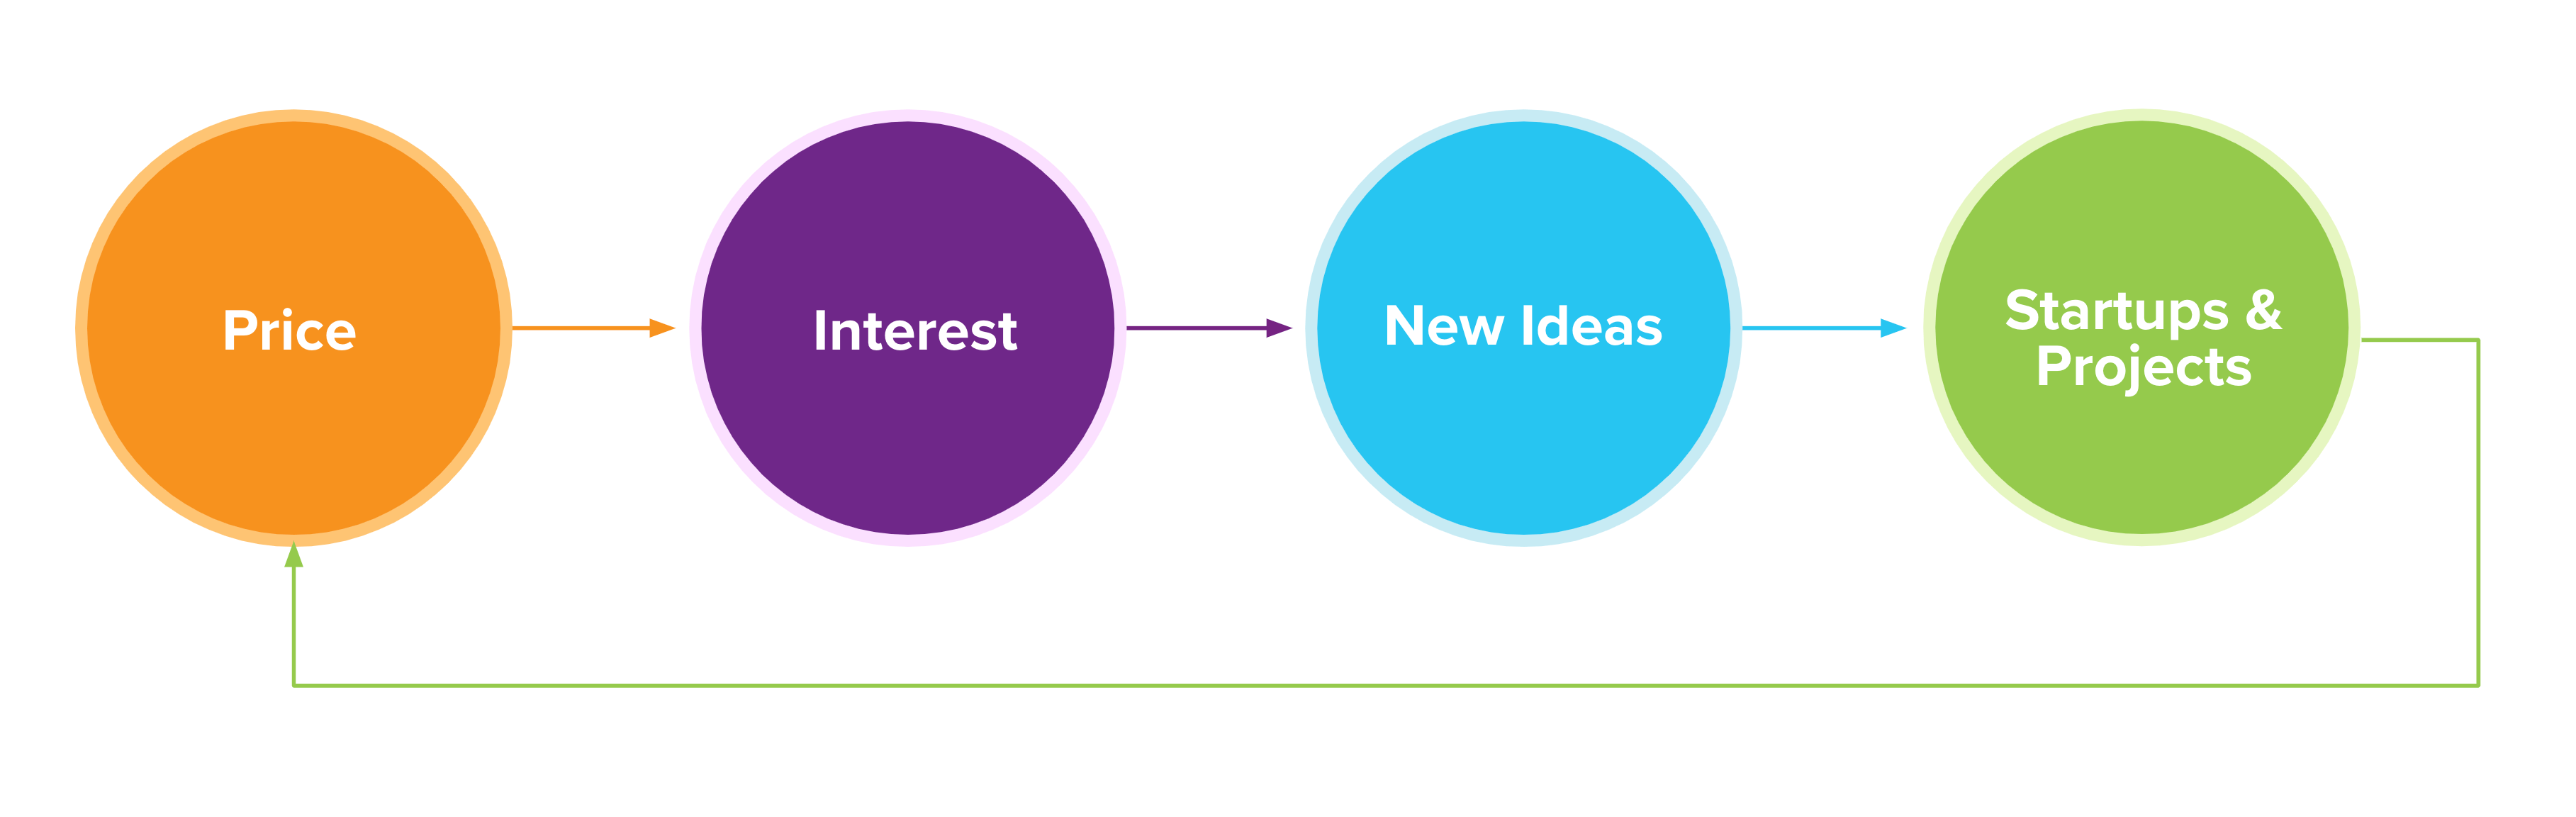
These cycles appear chaotic but have an underlying order, roughly characterized as 1) the price of Bitcoin and other crypto assets goes up, 2) leading to new interest and social media activity, 3) leading to more people getting involved, contributing new ideas and code, 4) leading to projects and startups getting created, 5) leading to product launches that inspire more people, eventually culminating in the next cycle.
This view is supported both anecdotally and with data. Anecdotally, of the hundreds of conversations with crypto founders we’ve had, we often hear stories like: “I heard about crypto in [2011, 2013, 2017] when the prices spiked and everyone was talking about it. At first, I thought it was just about money, but then I started reading white papers and blog posts, learned more about the potential of the technology, and eventually fell in love with it.”
Want more a16z?
Sign up to get our best articles, latest podcasts, and news on our investments emailed to you.
Thanks for signing up.
We recently ran an internal a16z project to see if the data would show similar patterns. Led by our crypto data scientist, Eddy Lazzarin, we analyzed 10 years of data, including Reddit comments in crypto subreddits, Github commits in crypto repos, and Pitchbook funding data (more on the methodology below). The results are shown in the following charts.
The First Cycle: 2009-2012
The first crypto cycle peaked in 2011. Before this, even enthusiasts thought of Bitcoin as an interesting experiment that was unlikely to have practical value. Afterwards, entrepreneurs realized you could create businesses in crypto. This was when many of today’s largest exchanges, miners, and wallets were founded.
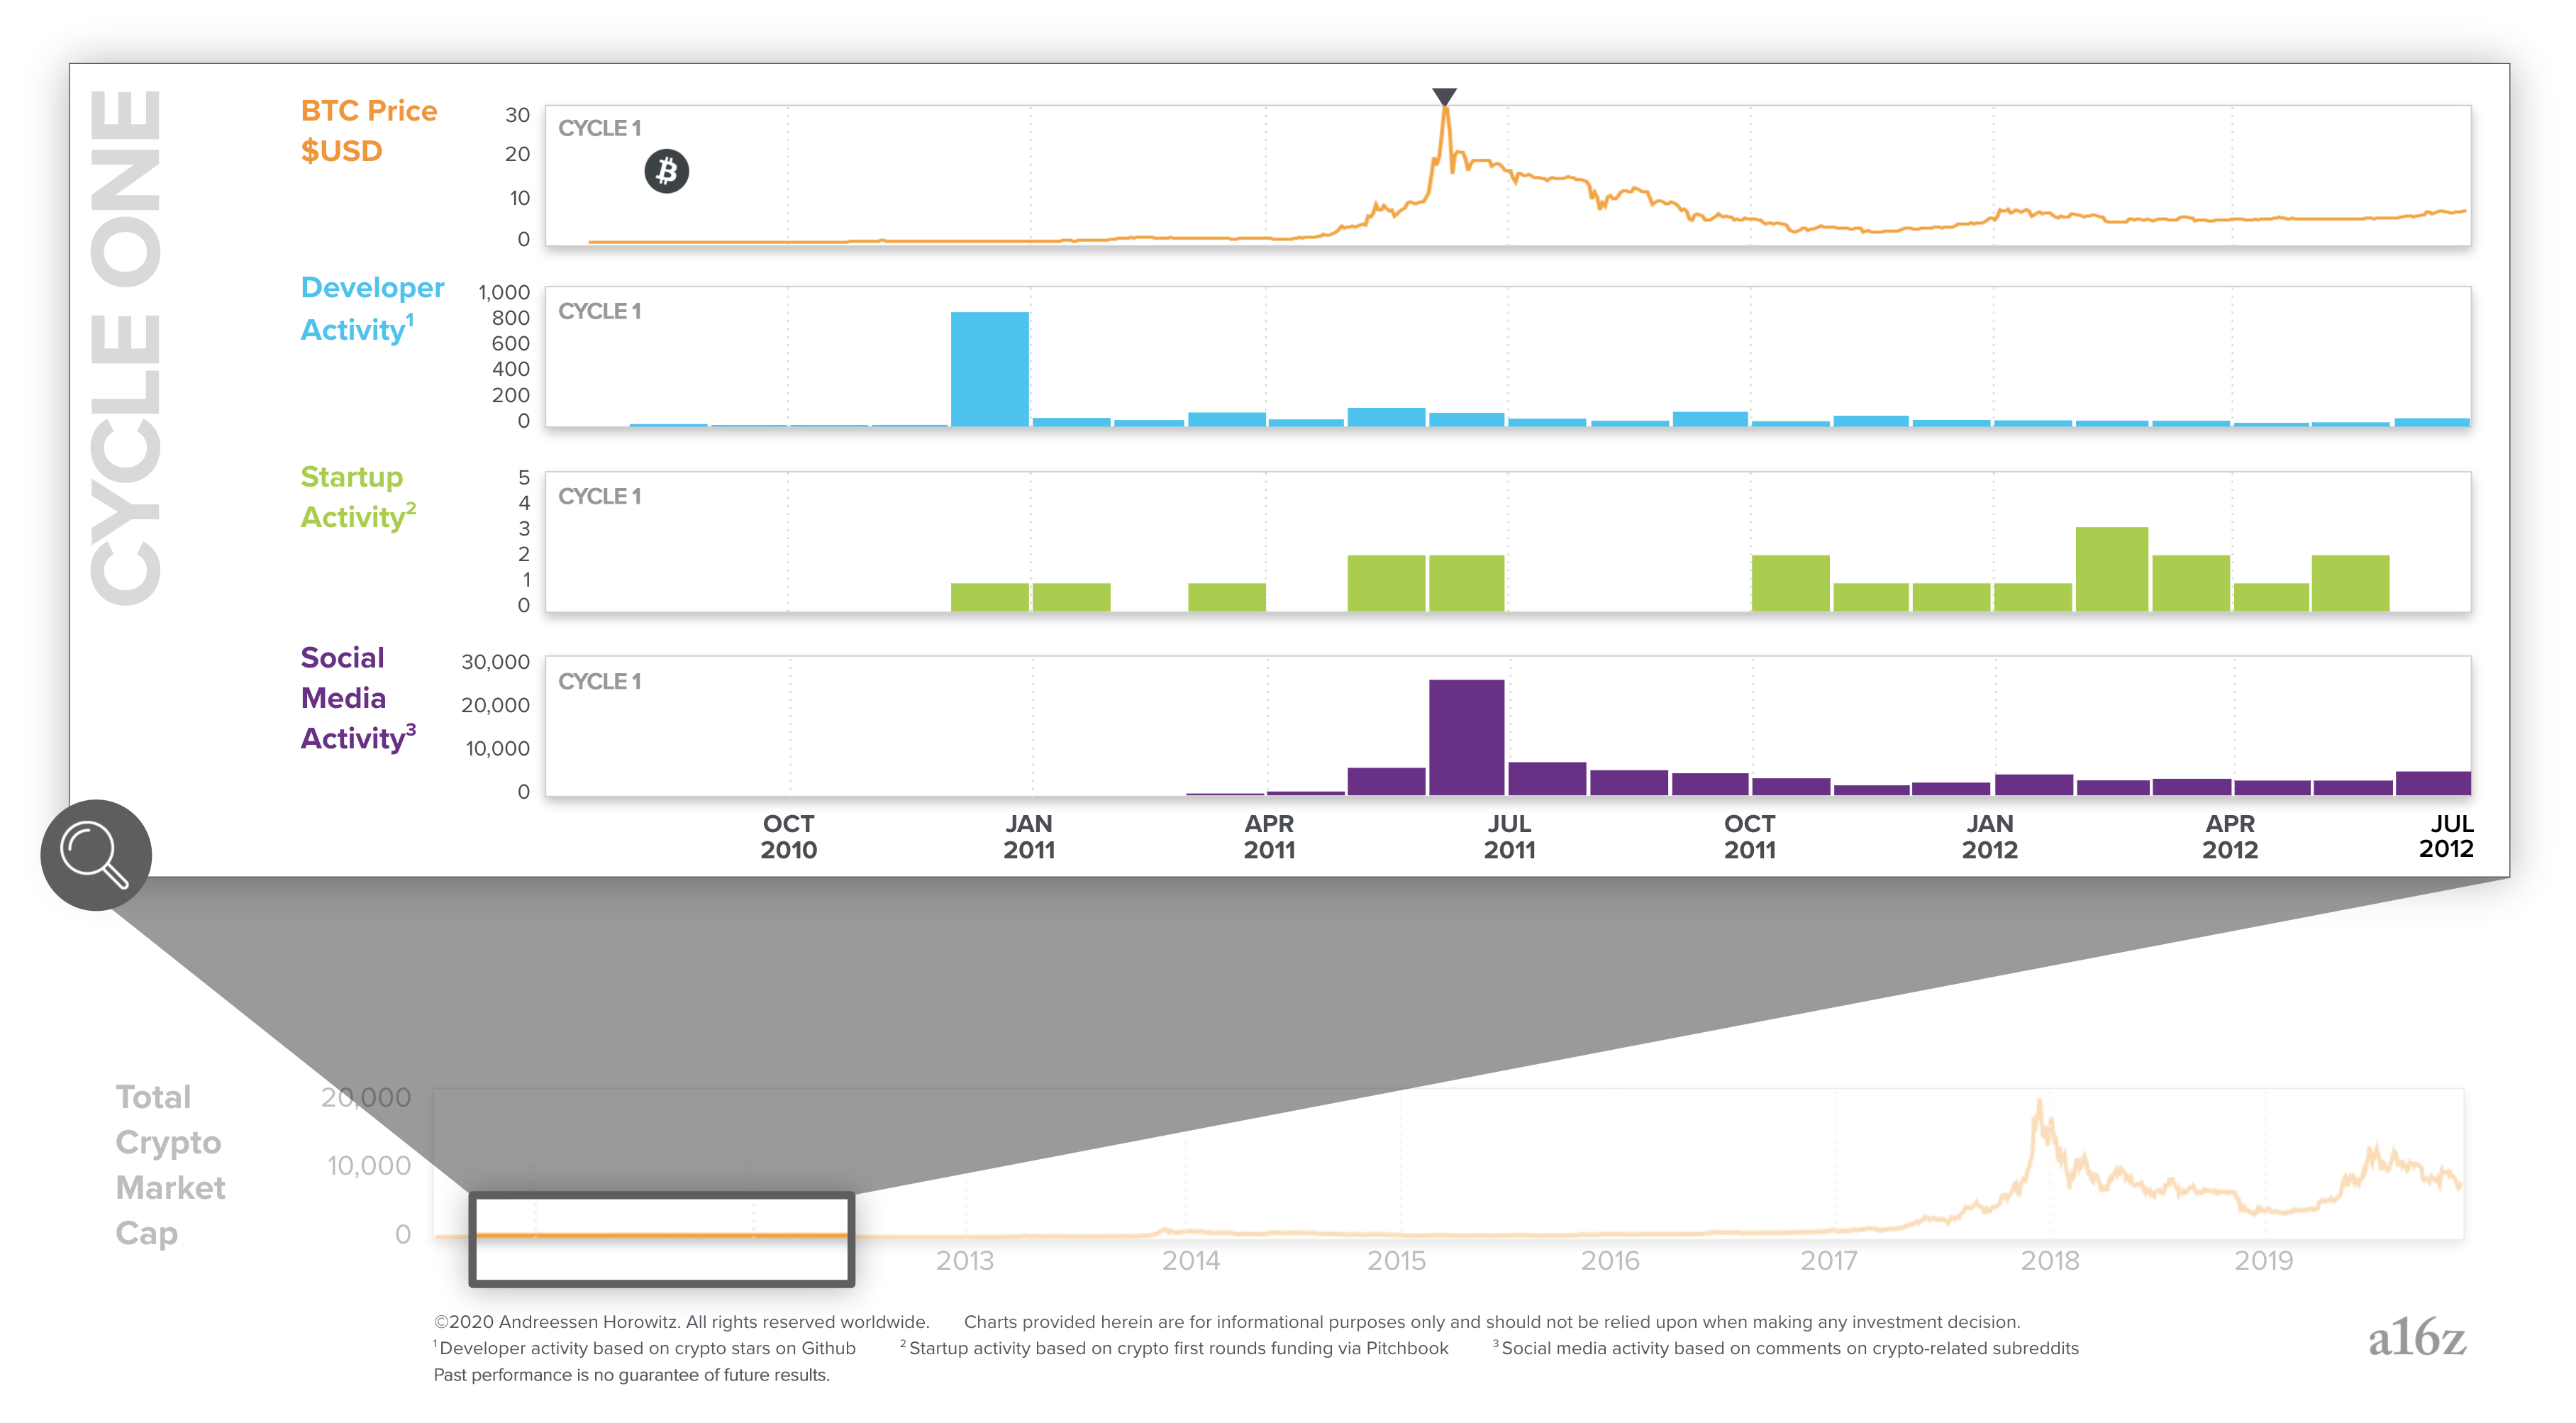
Notice how developer, social media, and startup activity is sustained even after prices decline. As we’ll see later, this is a consistent pattern that leads to long-term steady growth in fundamental innovation.
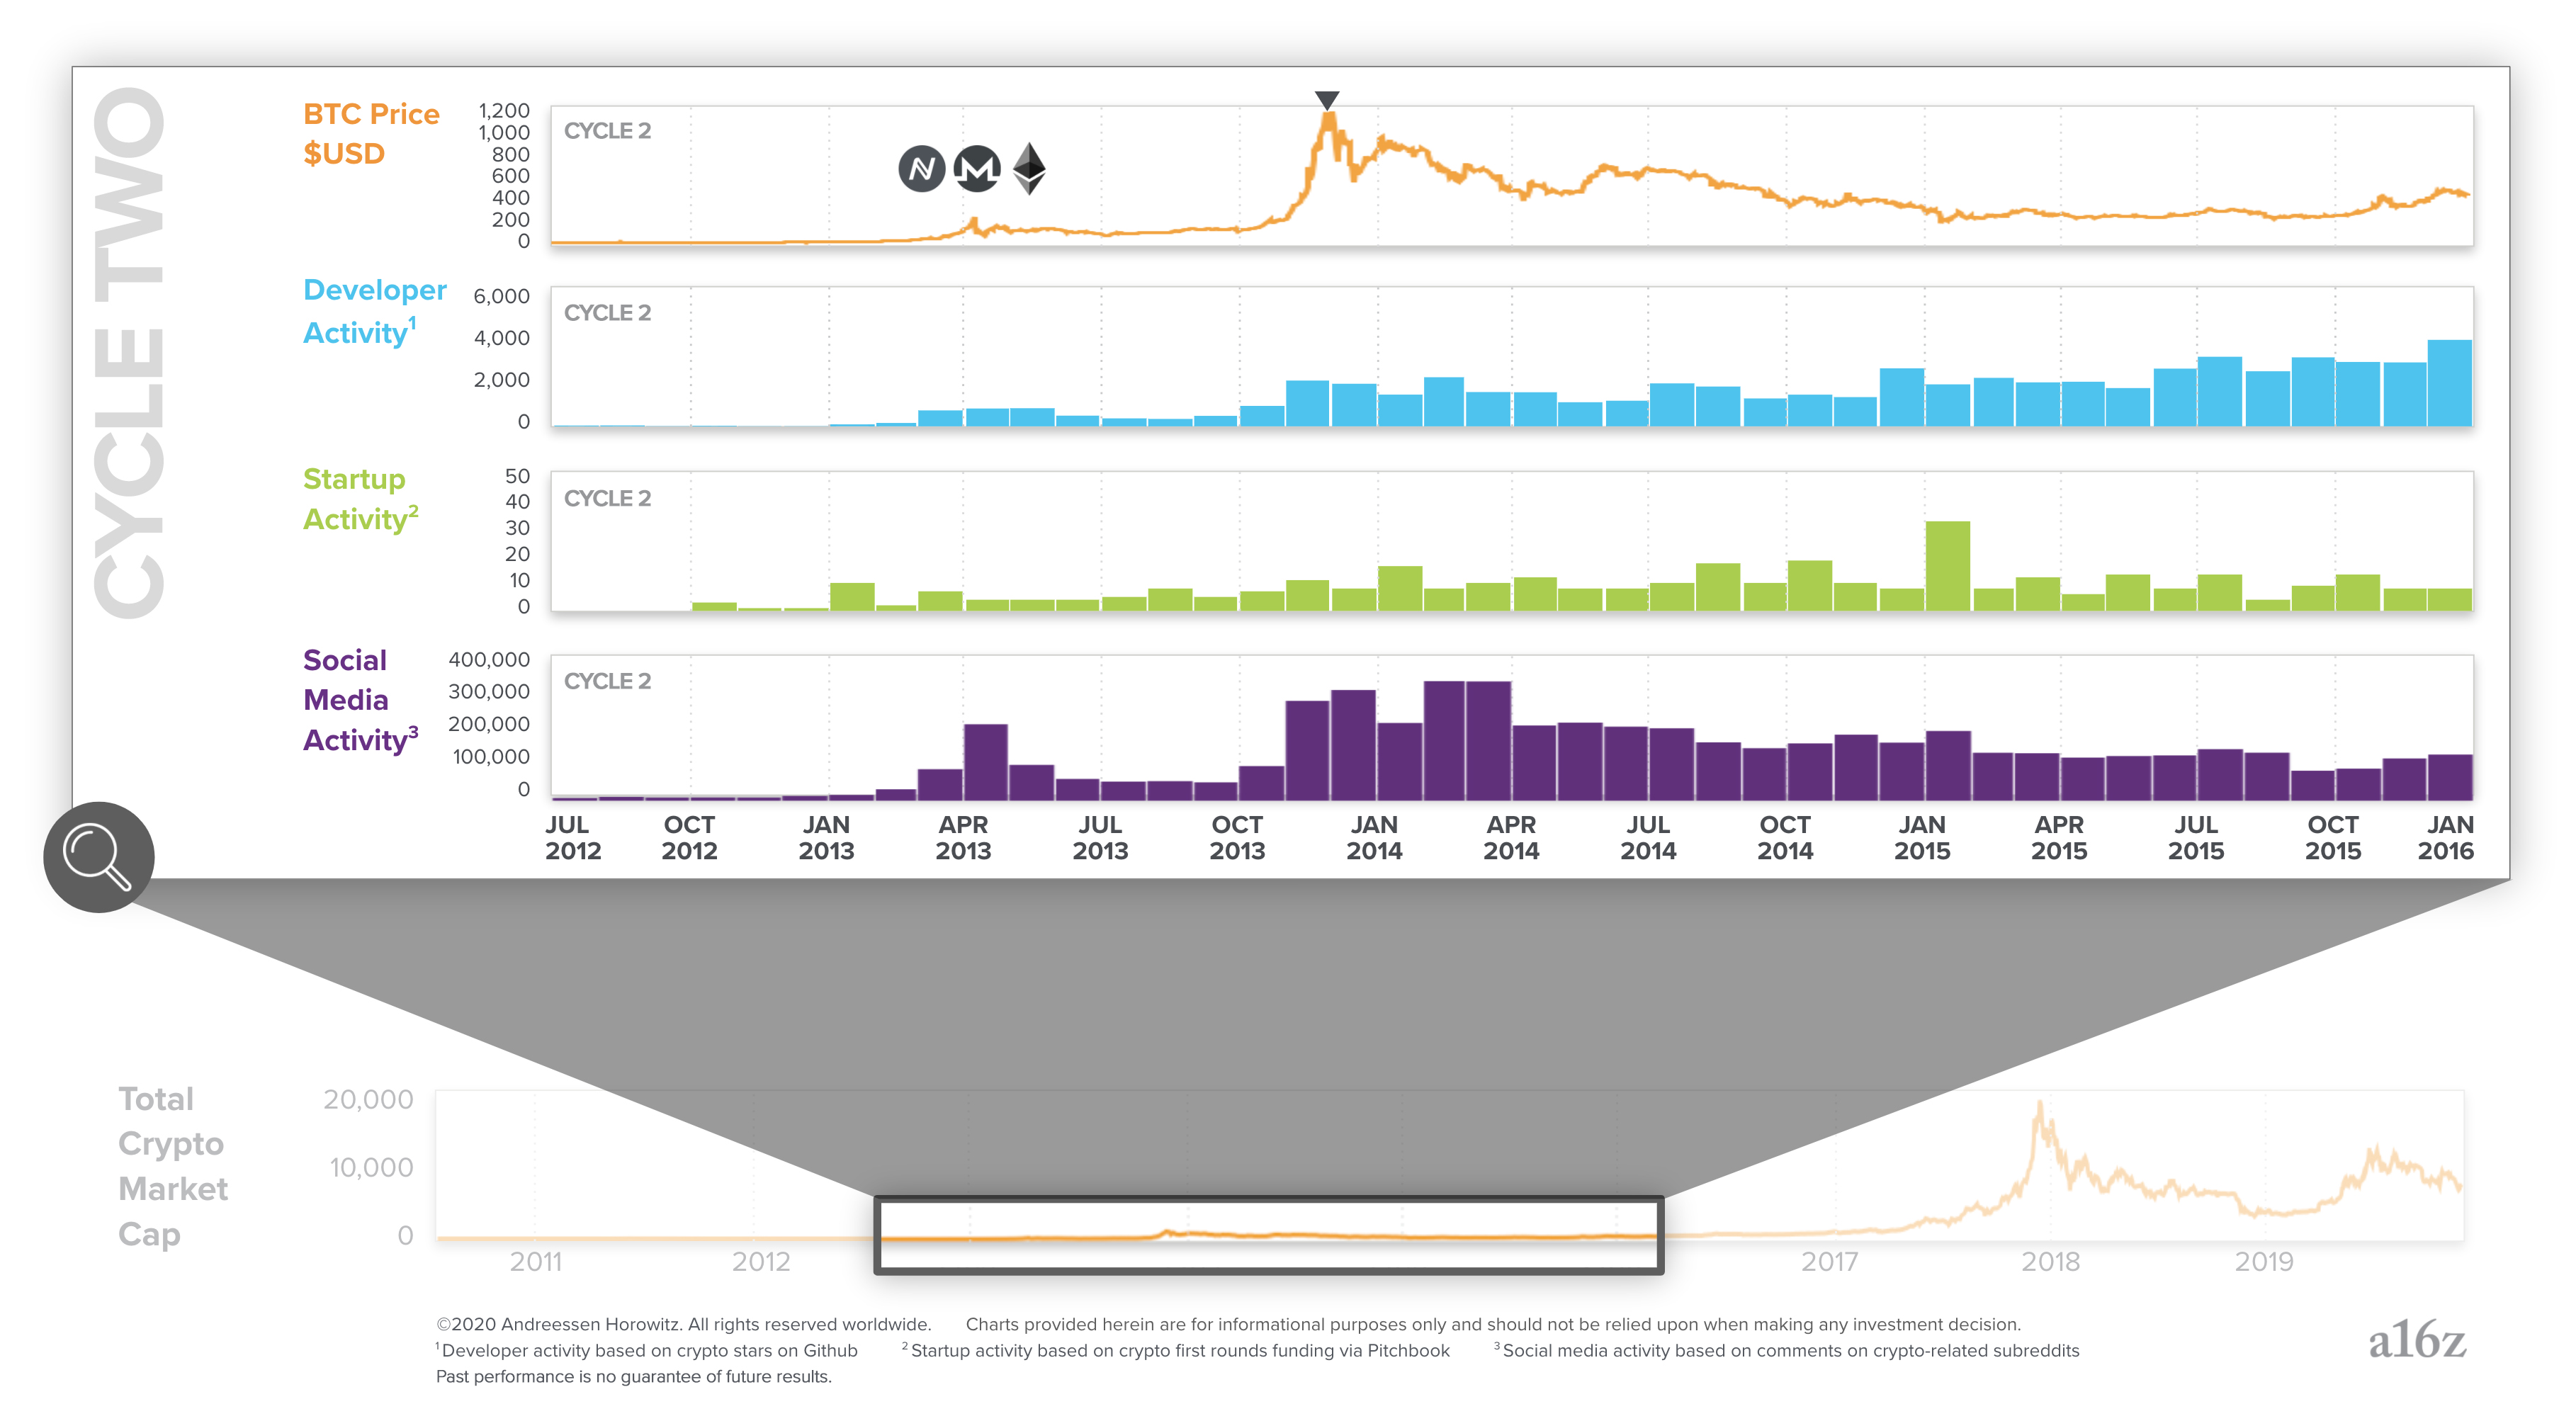
The Second Cycle: 2012-2016
The second cycle, which peaked in late 2013, is probably the first time most people outside of tech heard about Bitcoin. This cycle brought roughly 10x more developers and startups into the space. It was also when important projects were created and funded, most notably Ethereum, which drove a lot of the excitement in the third cycle in 2017. A key feature of crypto cycles is that each one plants seeds which later grow and drive the next cycle.
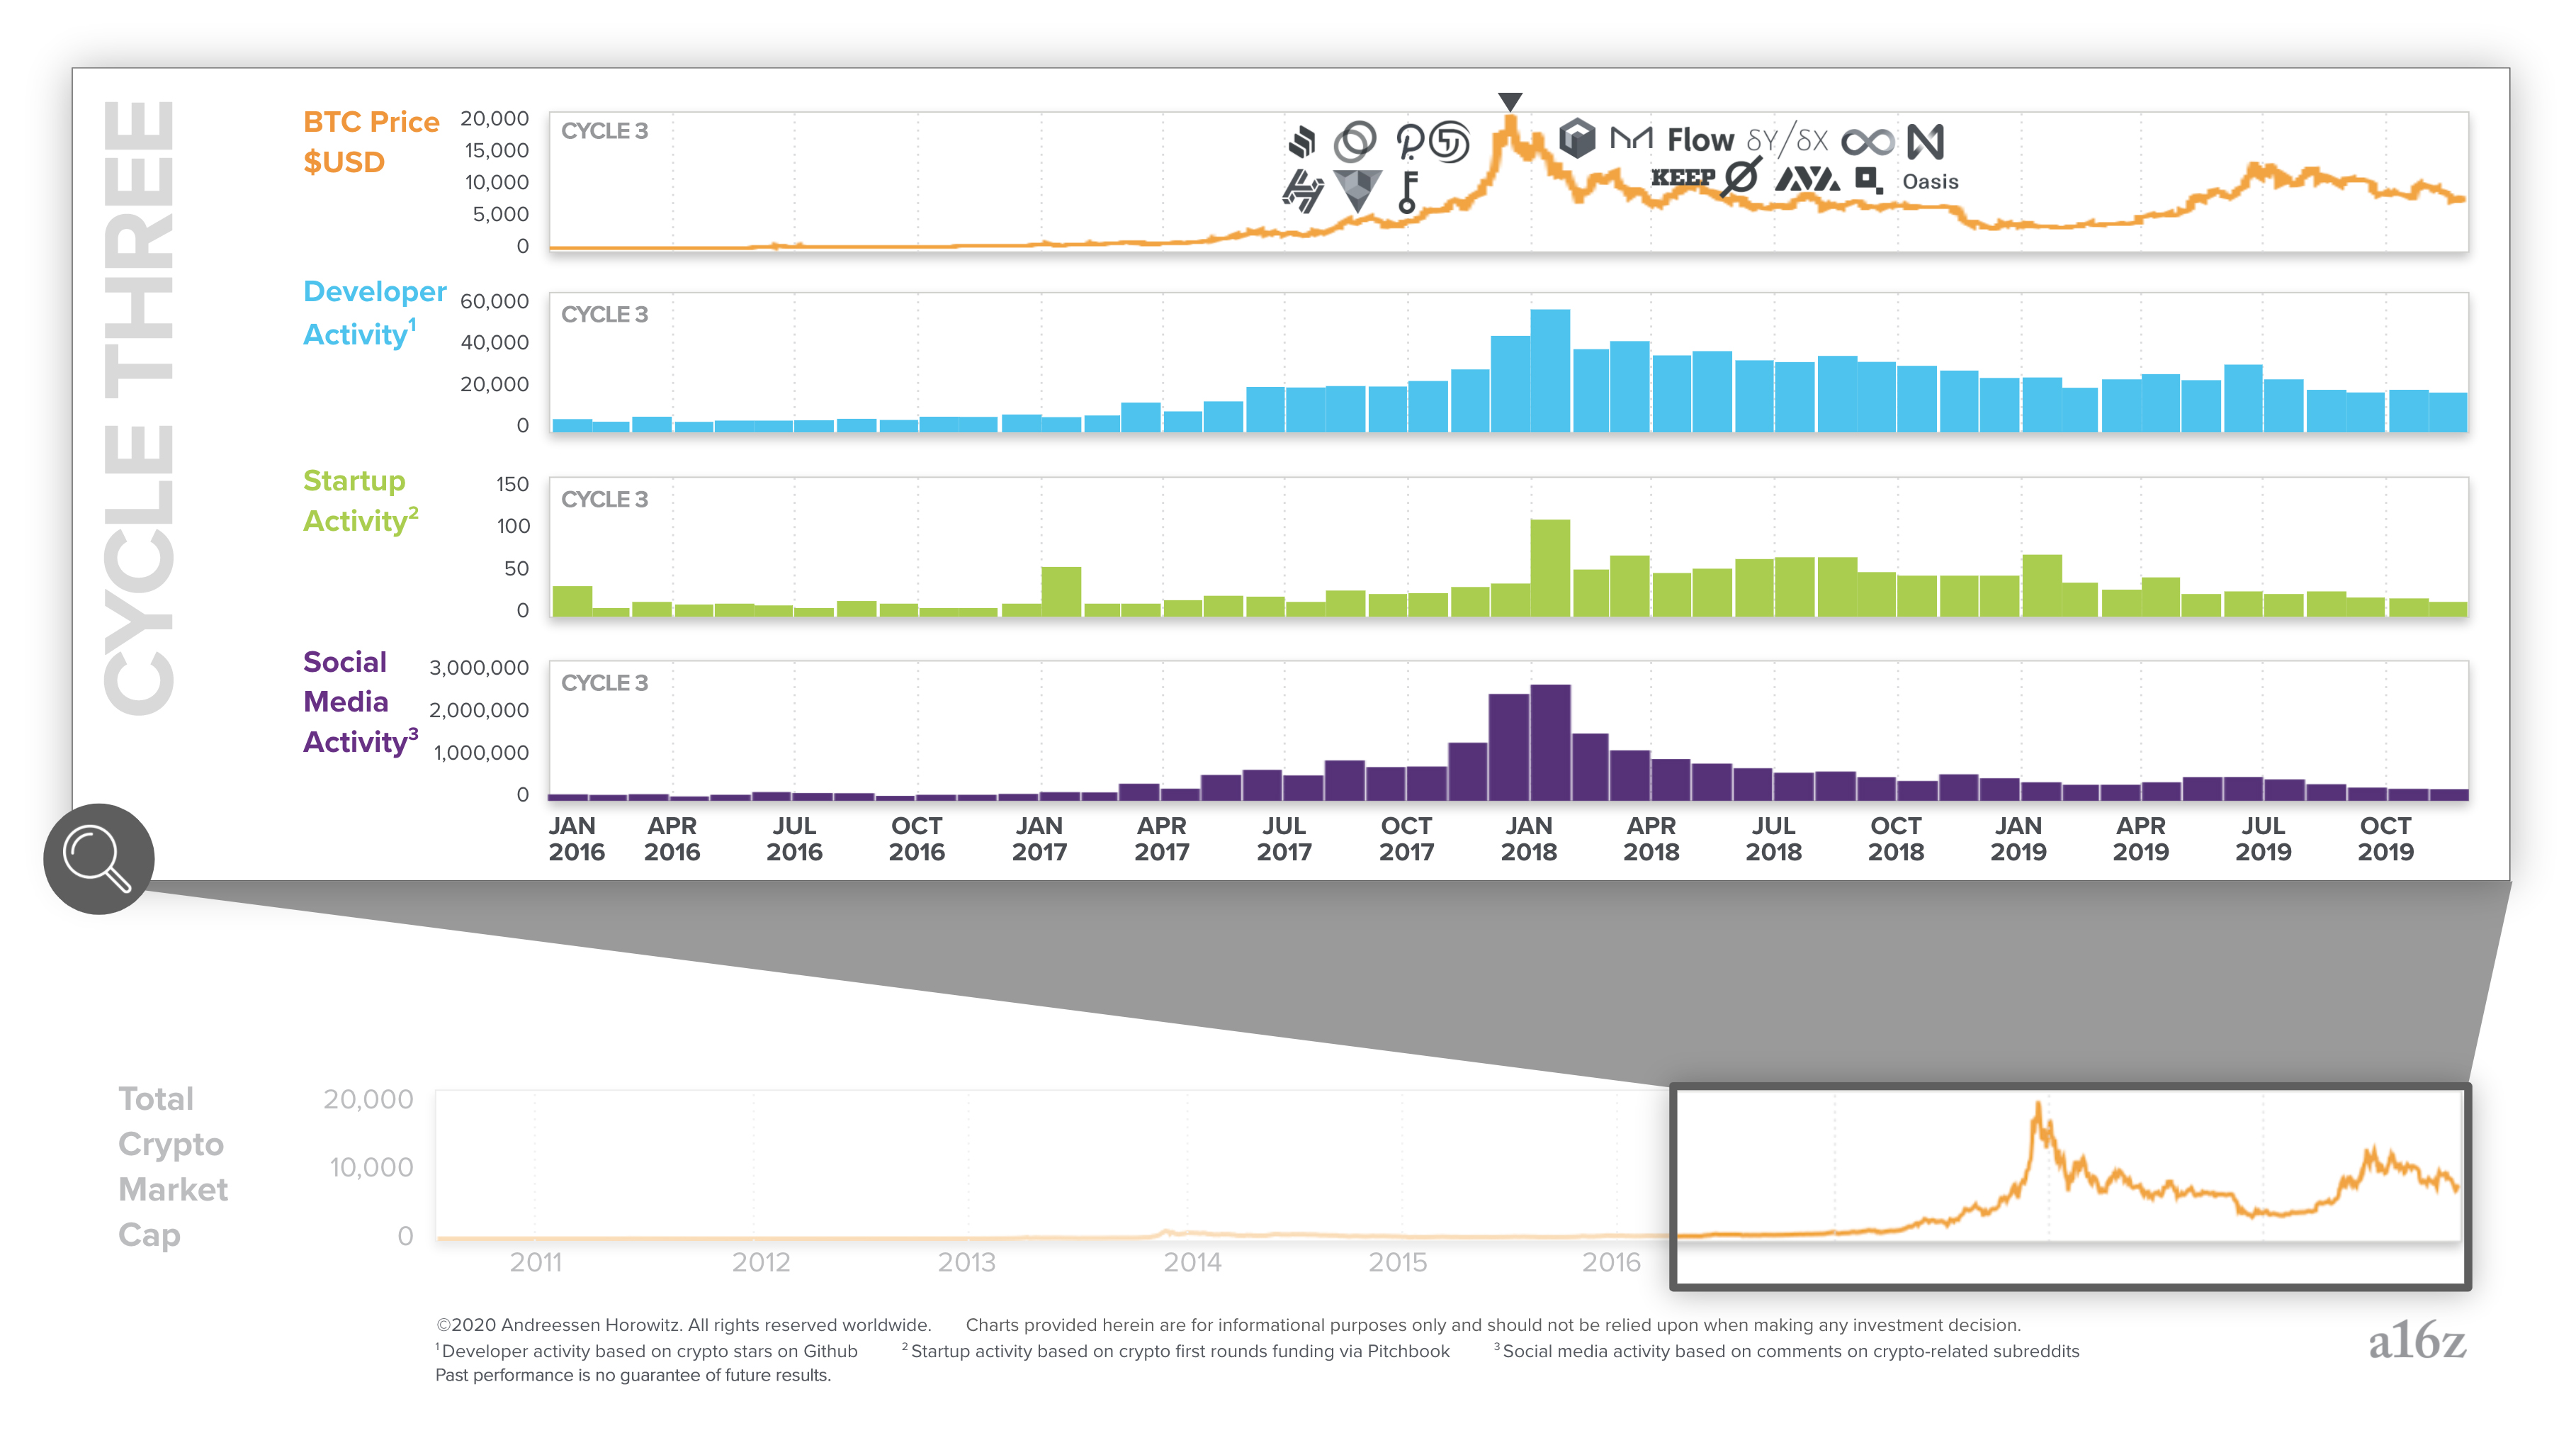
The Third Cycle: 2016-2019
The third cycle, reaching its peak in 2017, is when the broader implications of crypto captured mainstream attention. This cycle again increased the number of developers and startups in the space by another roughly 10x. Crypto moved from the fringe to become a bona fide startup sector.
Zooming back out, when you look at all three cycles combined you see choppy yet consistent growth in all of the key metrics:
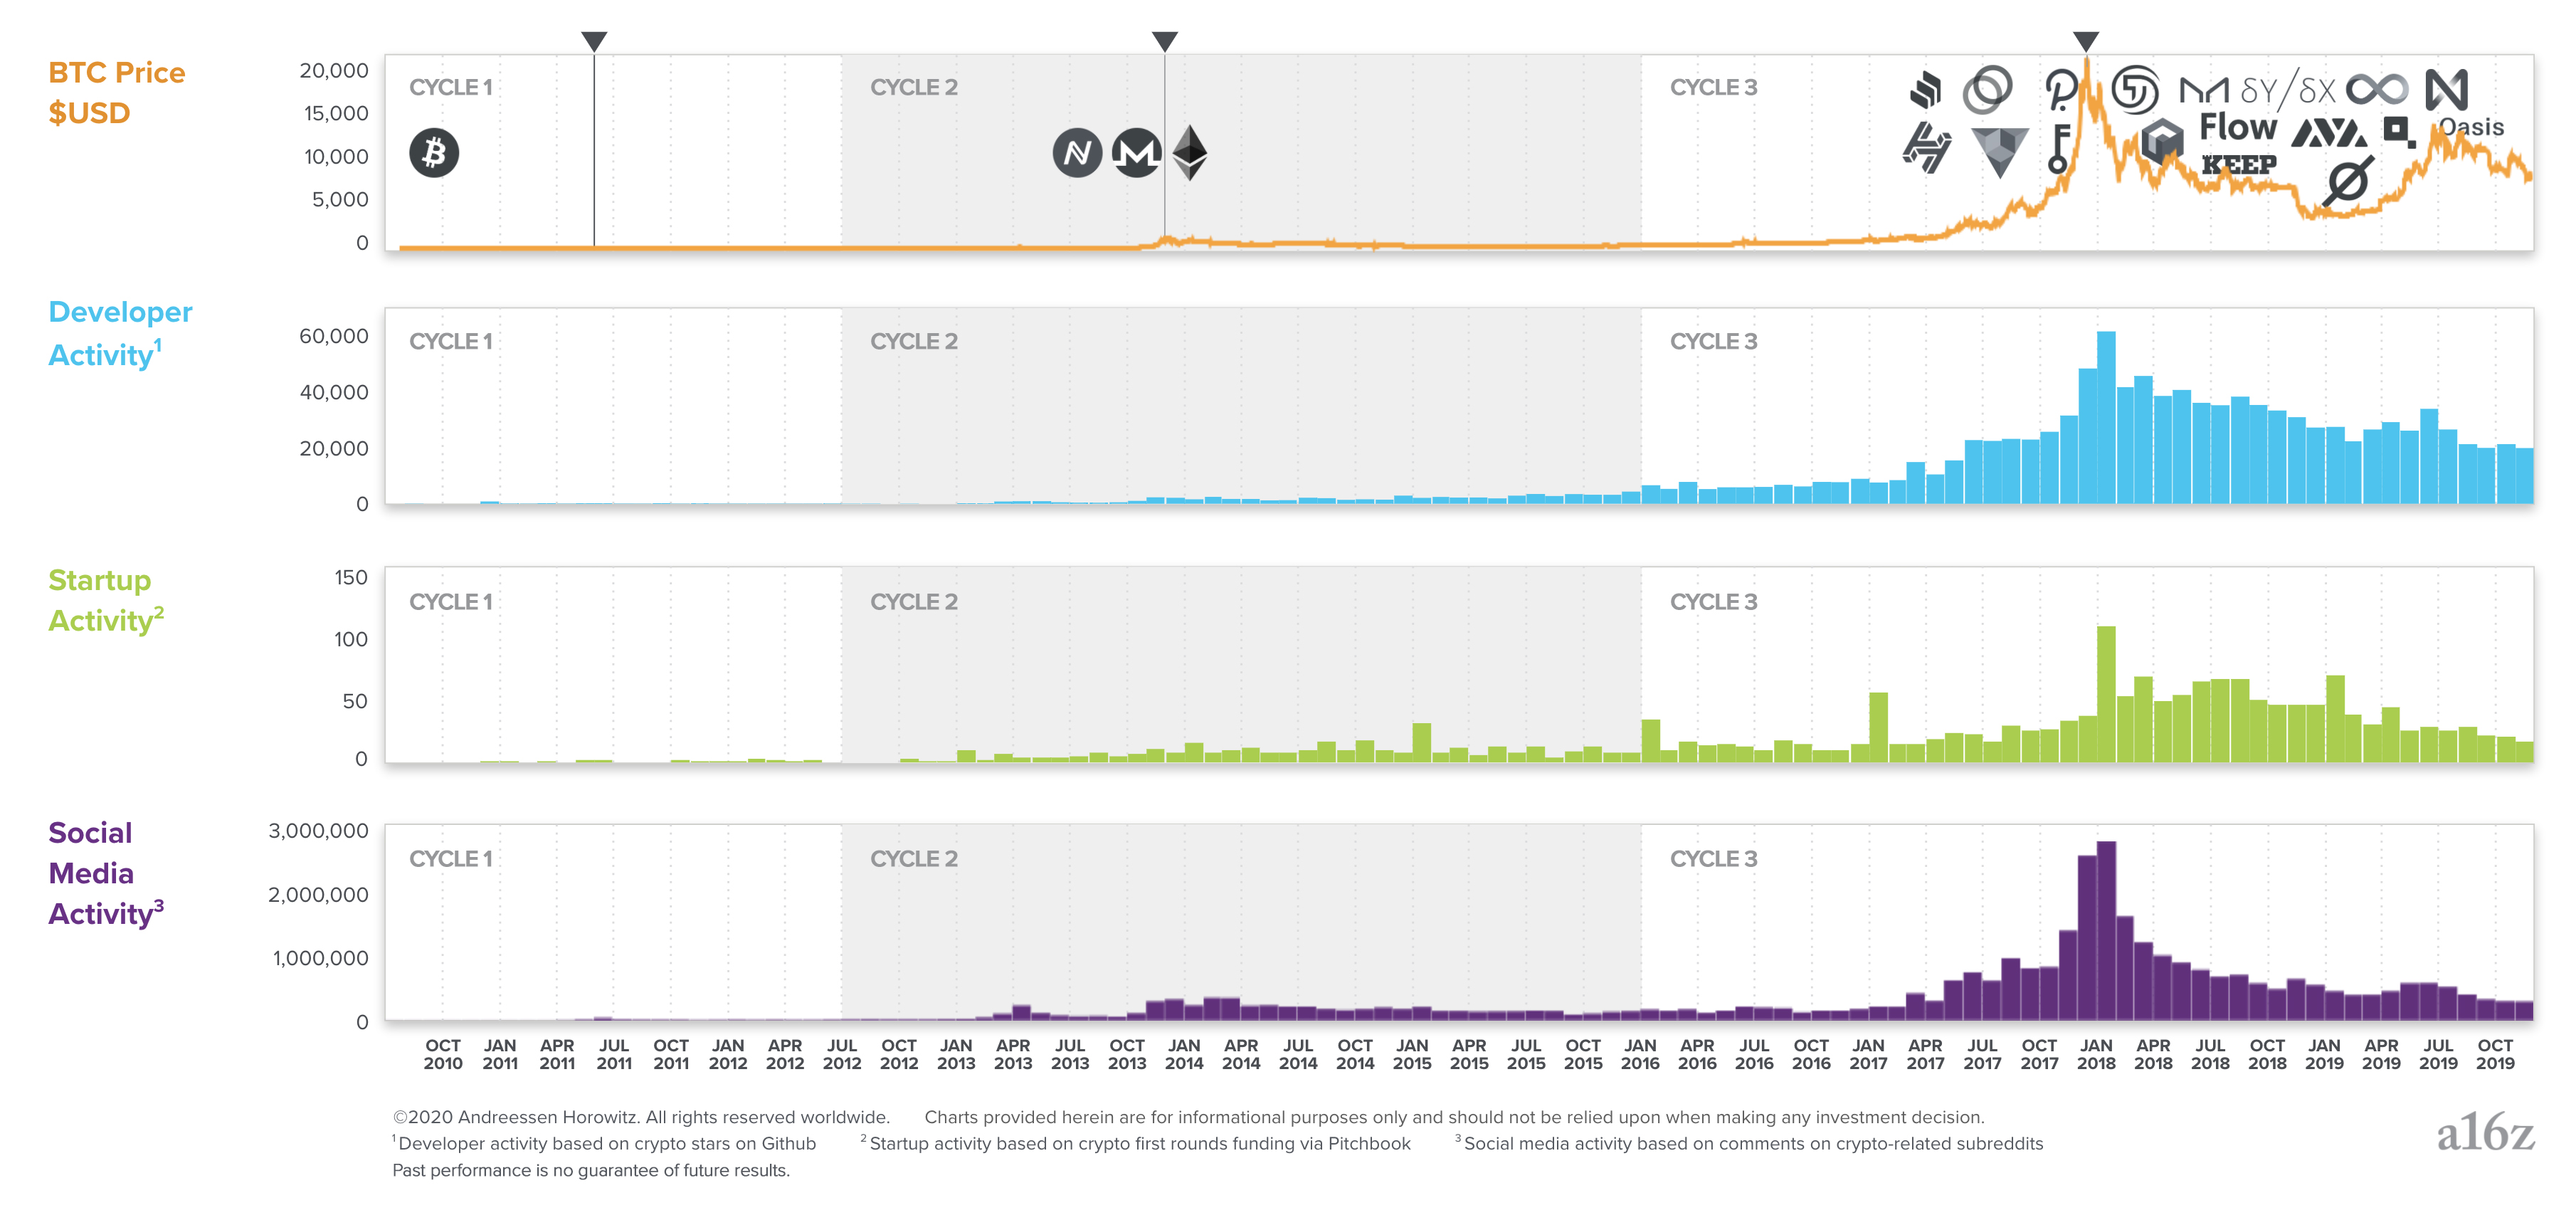
The logos in the top row are a sample of high quality projects started during each cycle. The 2017 cycle spawned dozens of exciting projects in a wide range of areas including payments, finance, games, infrastructure, and web apps. Many of these projects are launching in the near future, possibly driving a fourth crypto cycle.
Finally, here are the compound annual growth rates for each metric from 2010 to the present:
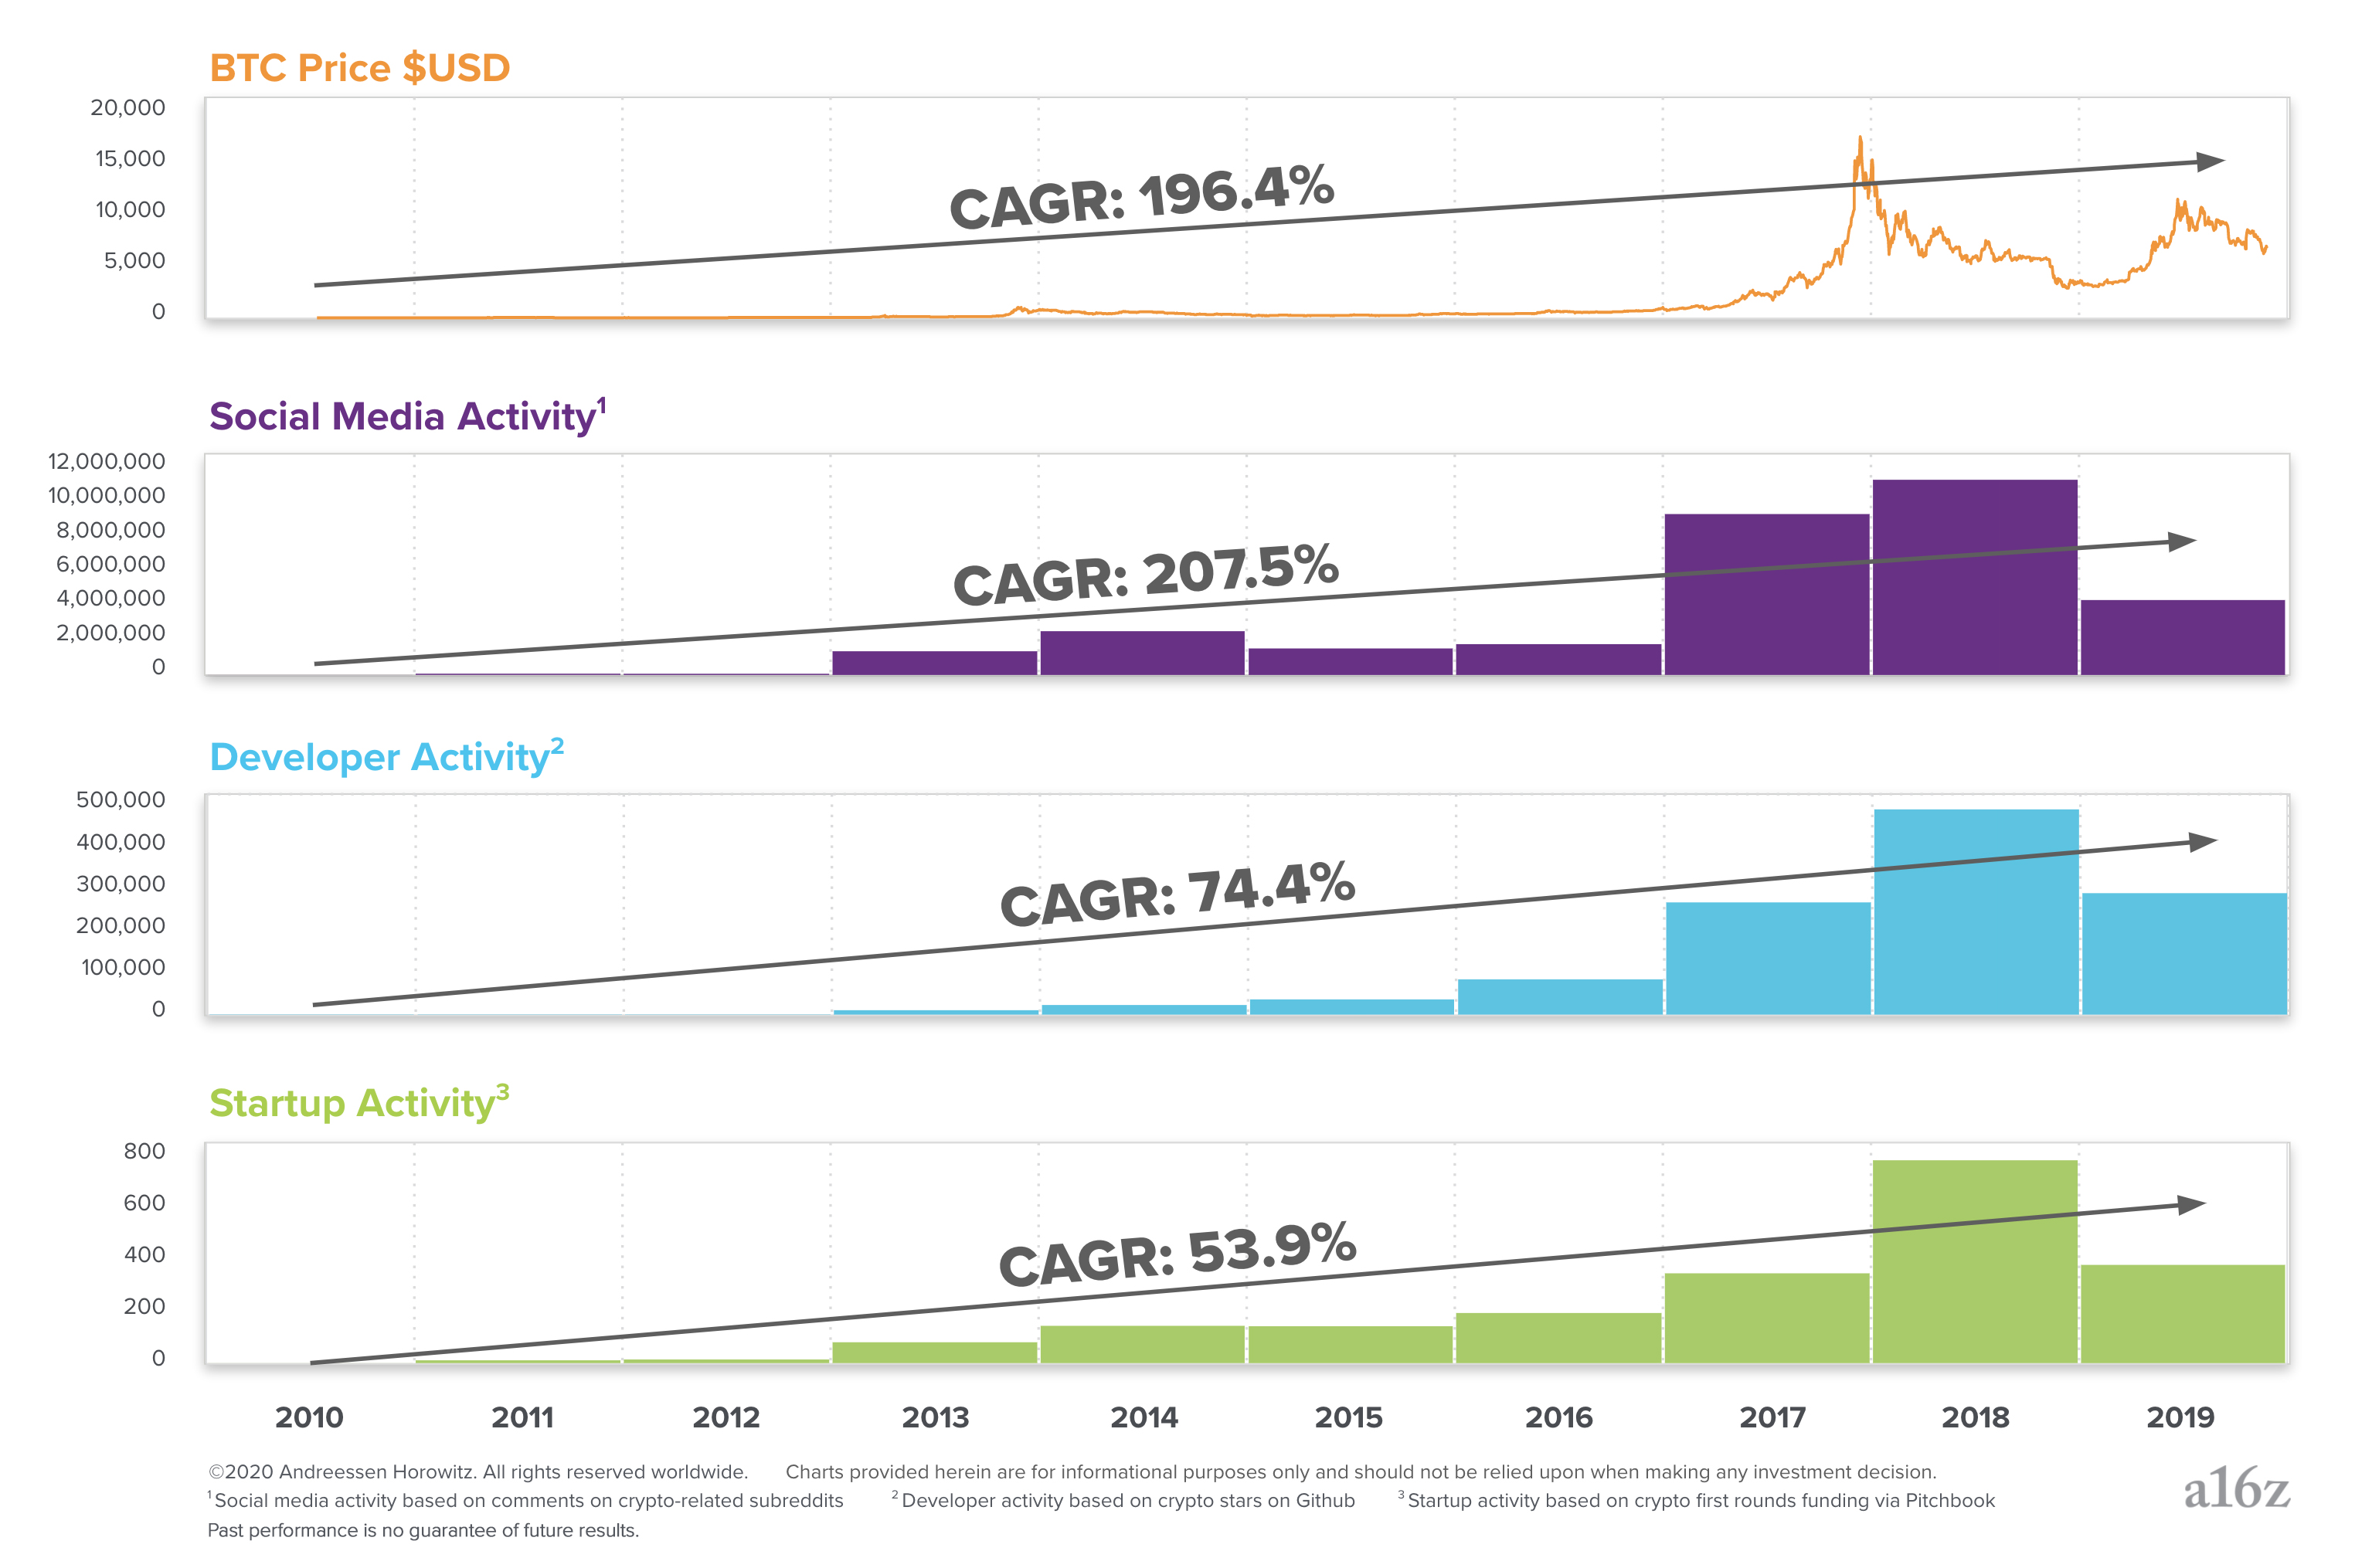
Even though crypto cycles look chaotic, over the long term they’ve generated steady growth of new ideas, code, projects, and startups — the fundamental drivers of software innovation. Technologists and entrepreneurs will continue to push crypto forward in the coming years. We are excited to see what they build.
Methodology:
- Startup activity is the count of all companies on Pitchbook founded after January 1, 2009 that raised their first round of financing in the “Cryptocurrency/Blockchain” vertical. Data includes only financing rounds where the year and month are provided. A few companies unrelated to cryptocurrency and blockchains were excluded manually. Data was exported directly from Pitchbook.
- Developer activity is the sum of all “stars” on GitHub across crypto-related repositories identified as of Feb. 4, 2020 in the Crypto Ecosystems project. The classifications were used without modification. Data was collected directly from GitHub’s API.
- Social media activity is the count of all comments from 91 crypto-related subreddits. These subreddits were identified using dozens of queries against raw data with crypto-related keywords, and then verified manually. Data was collected from PushShift.io.
- All of the data presented is either monthly or yearly as indicated, and is not cumulative.
- The first three charts reflect each individual period only and are meant to illustrate trends in that given period; the fourth chart shows the overall trend from 2009 through 2019.
See Chris Dixon discuss the crypto price-innovation cycle in week one of the recent a16z Crypto Startup School (click here to see full-length presentations from the school):